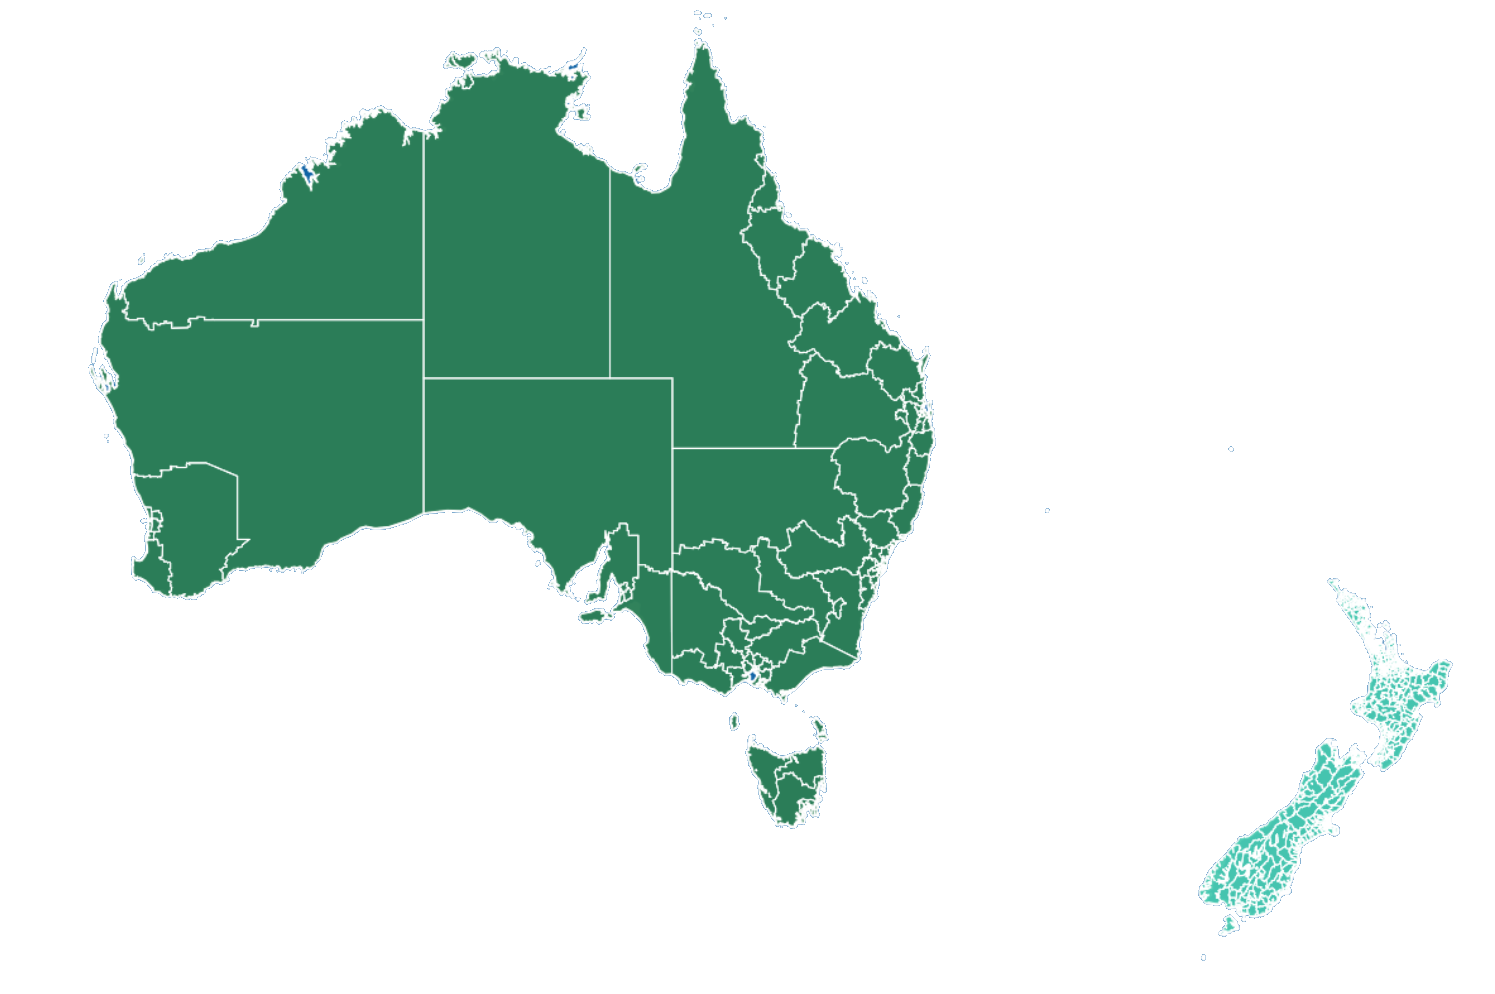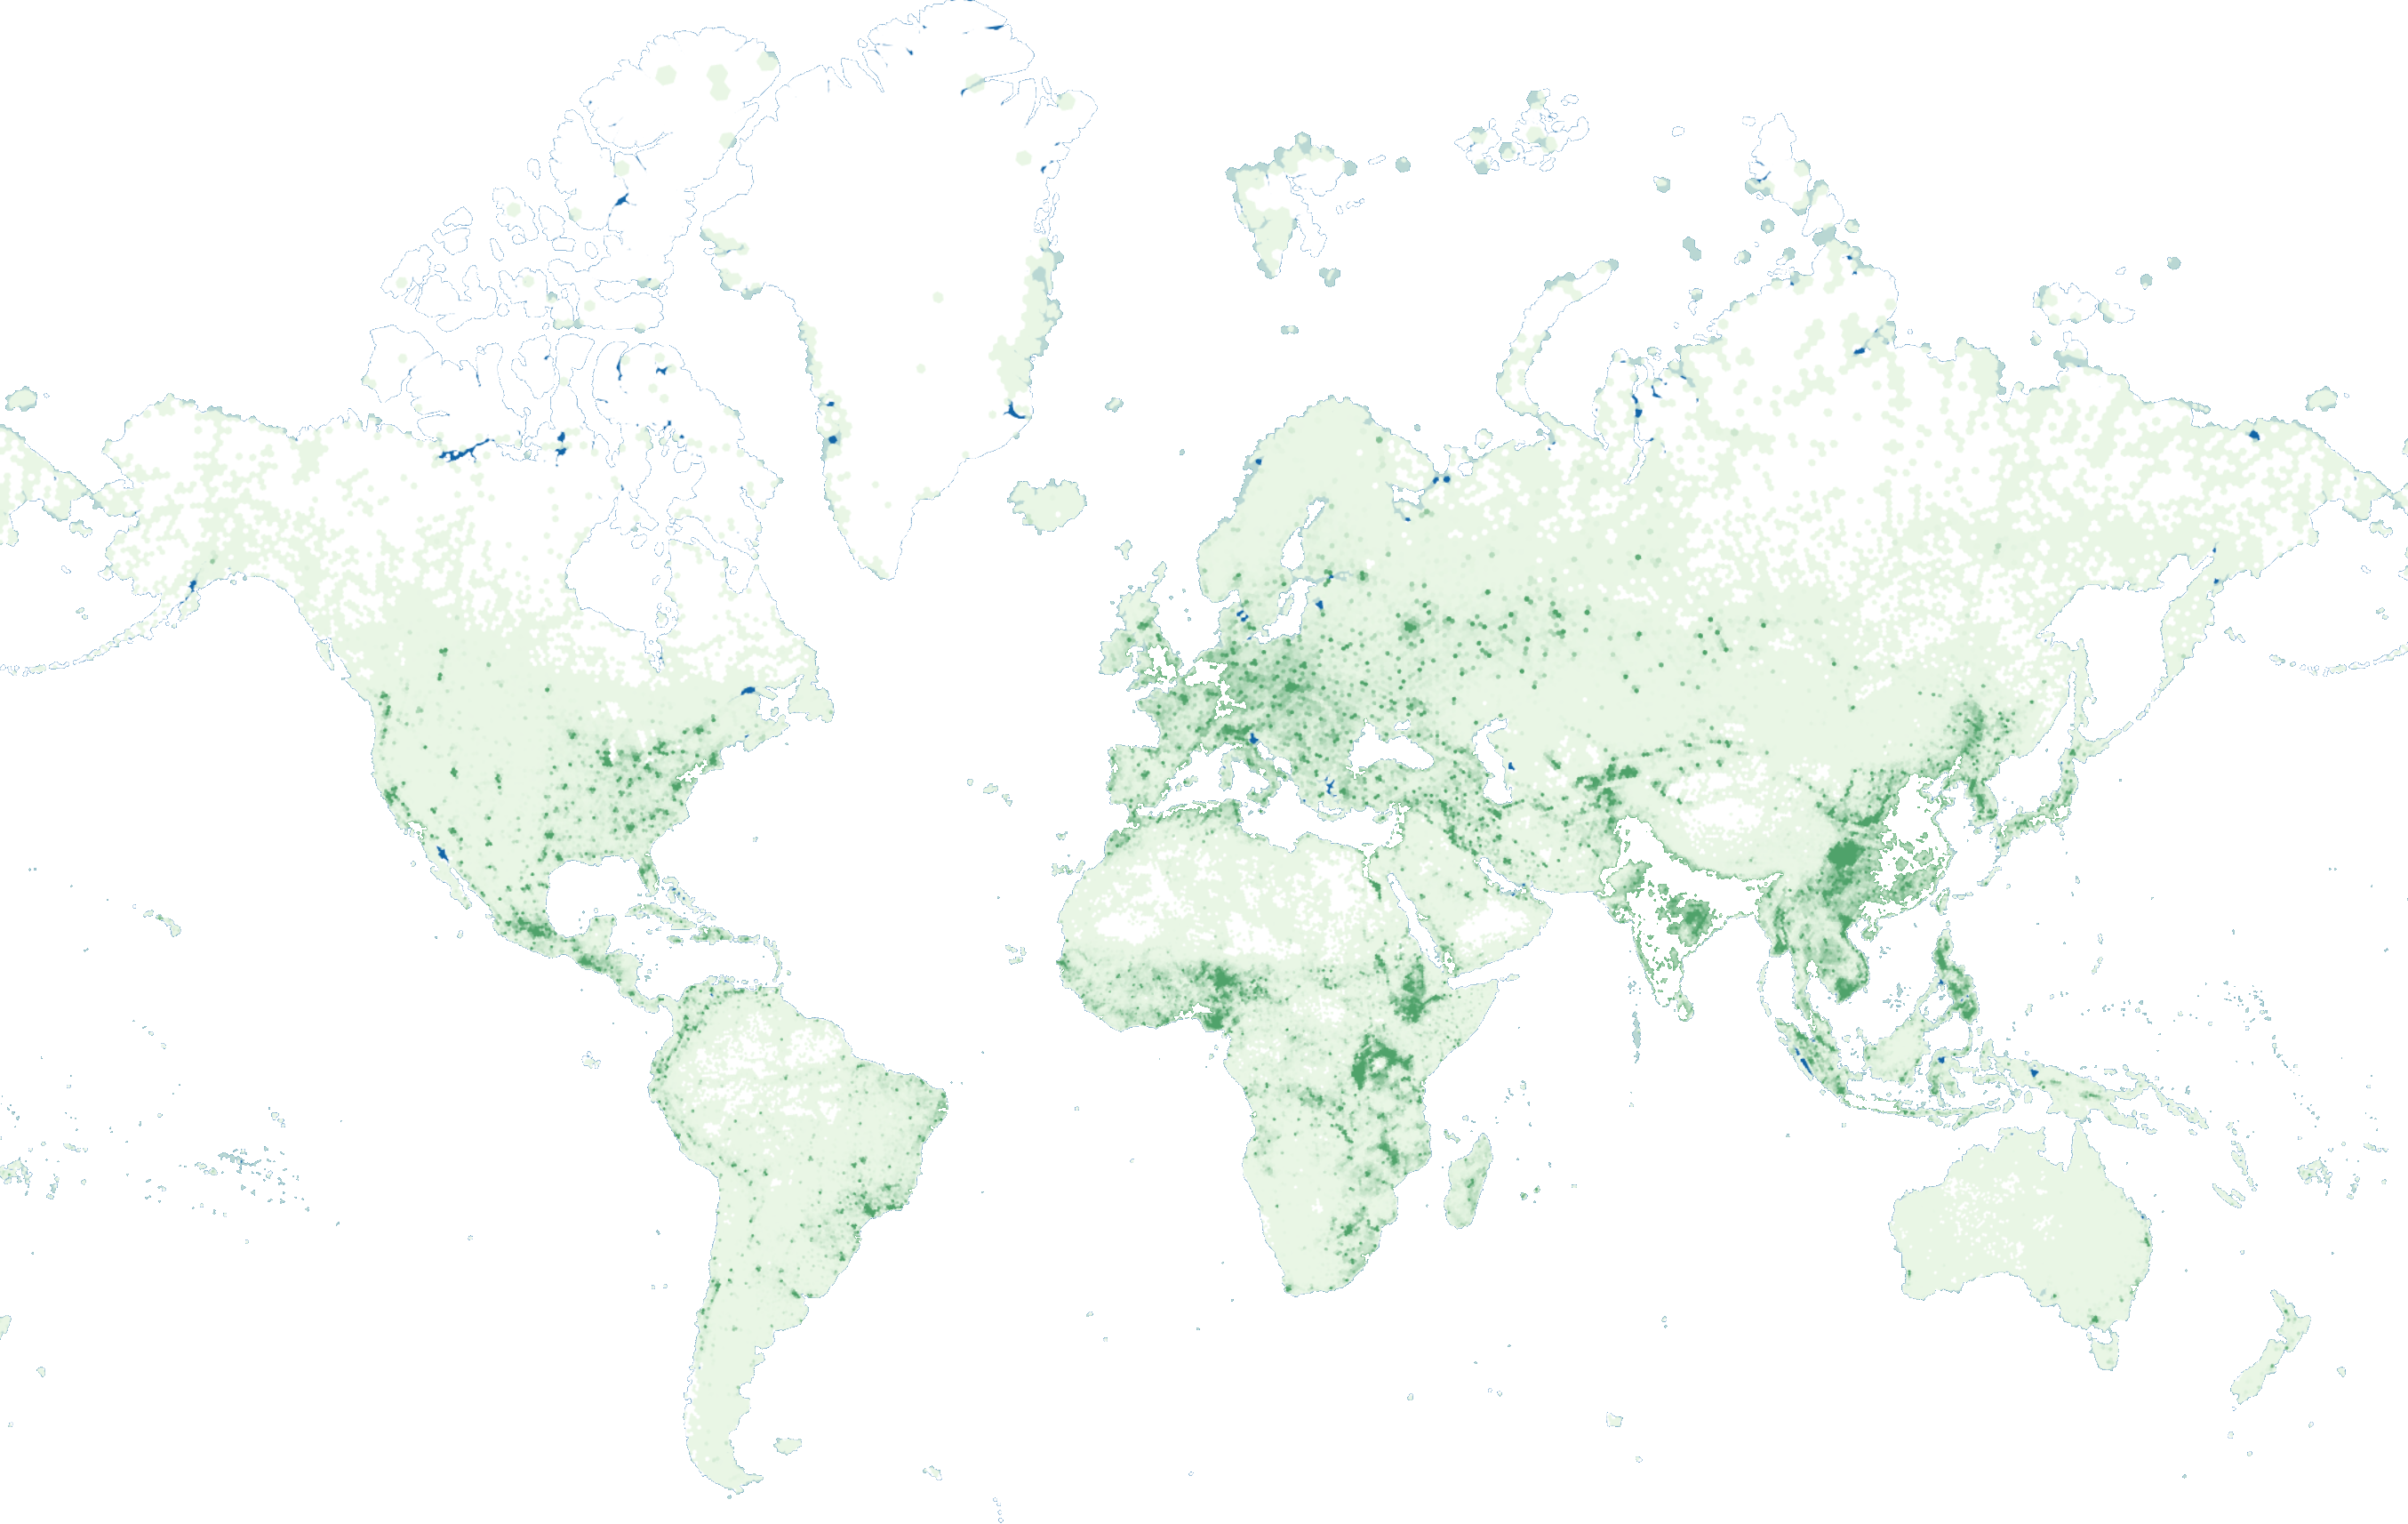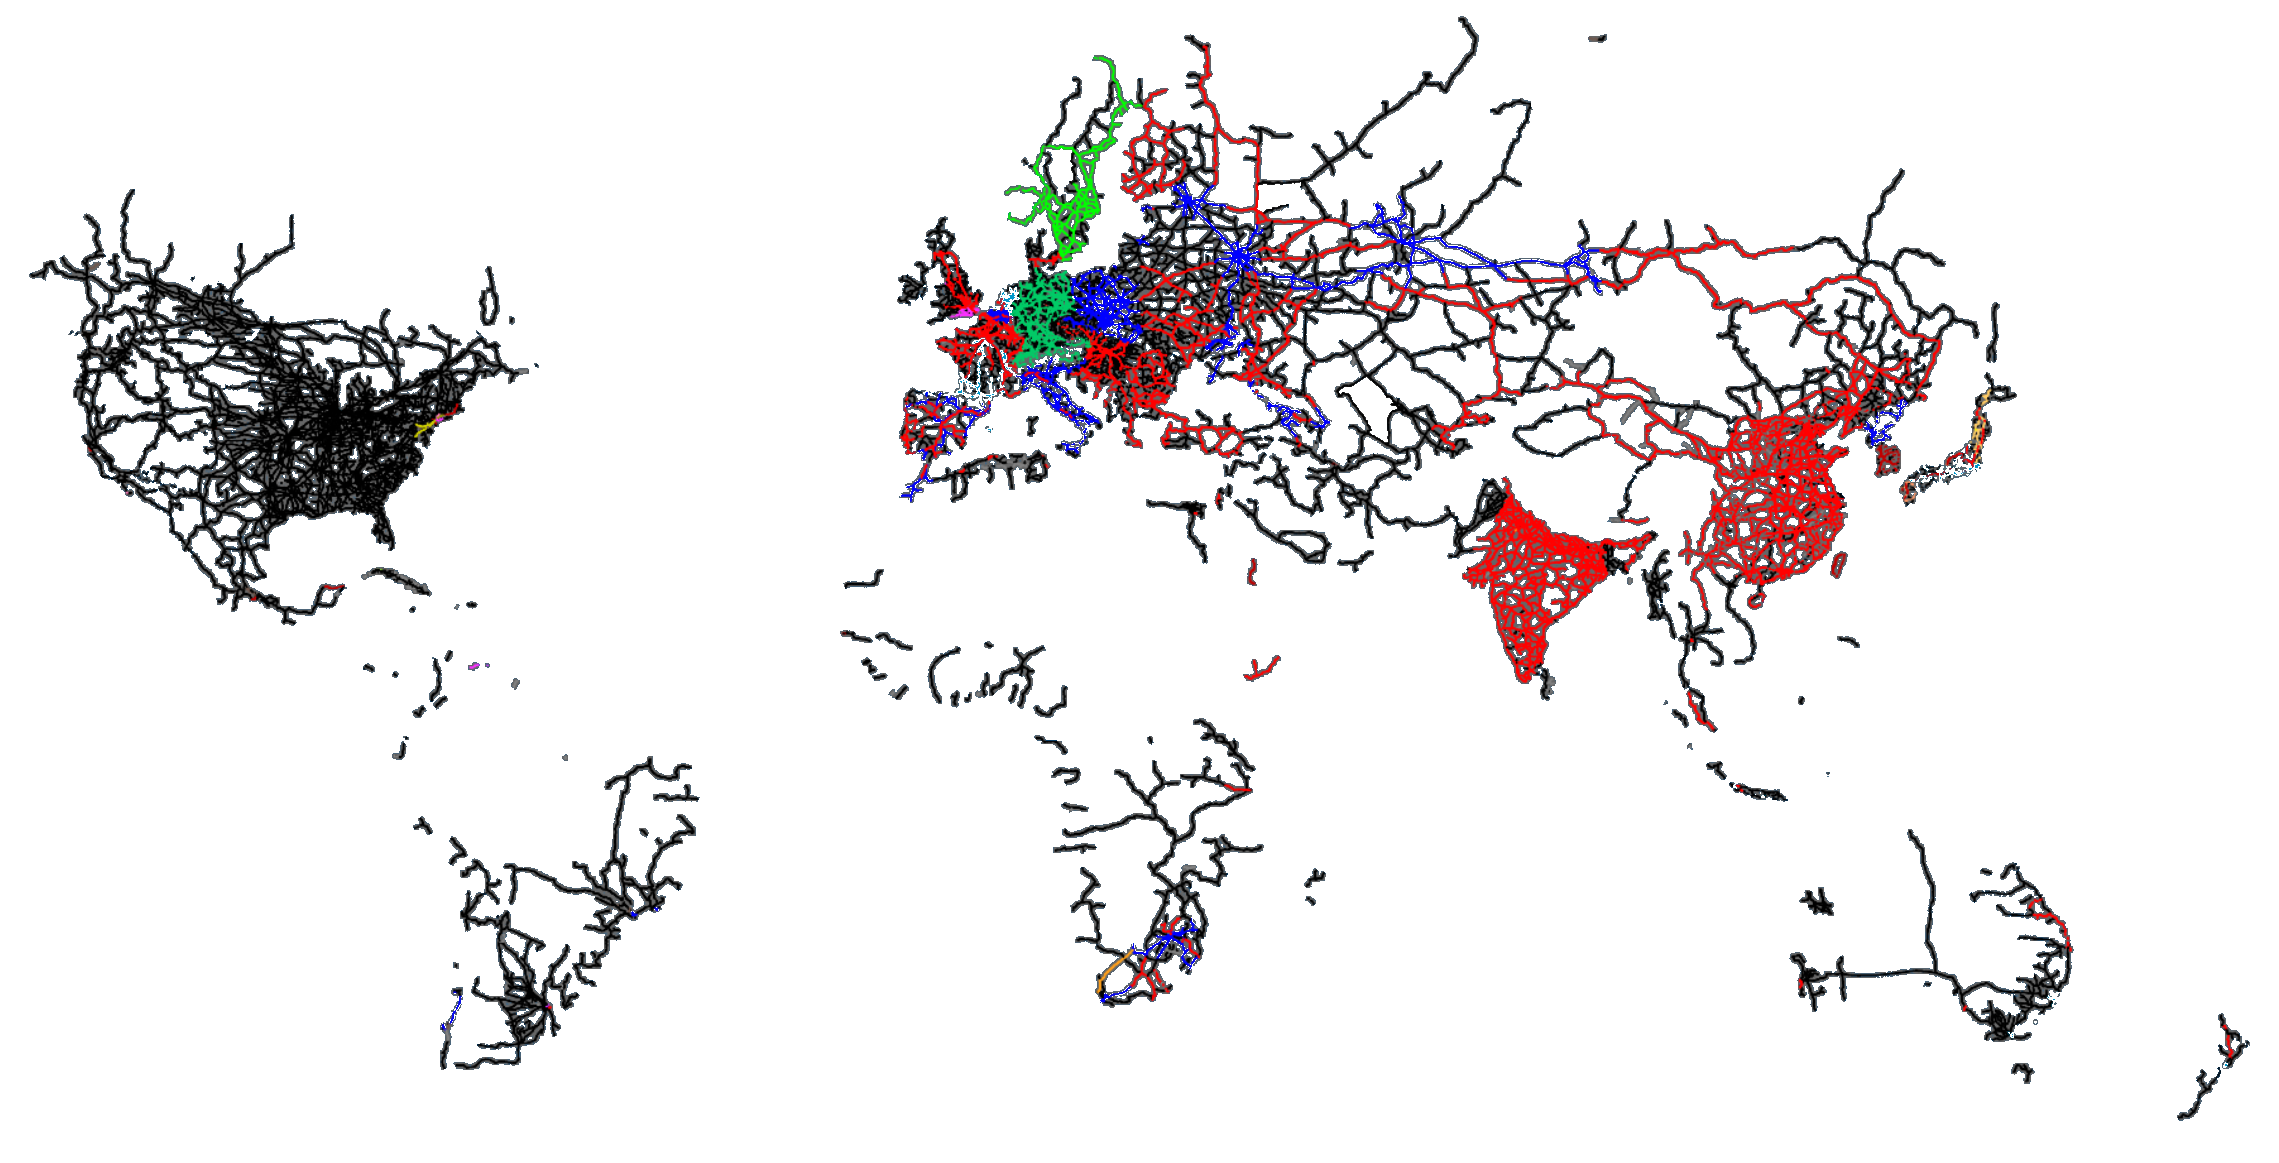
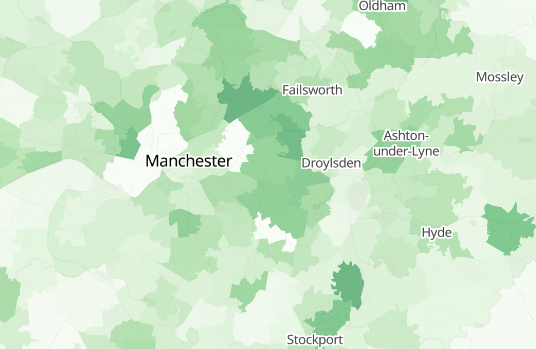
Bind your Power BI measures directly to map geometry
Boundary, infrastructure and point-of-interest layers in the catalog are data-bindable. Drop a layer onto an Icon Map Pro or Icon Map Slicer visual, drag in your own measure, and every feature inherits your value. Configure conditional formatting exactly as you would on a Power BI table - gradient stops, rule-based colours, icons, opacity and labels - all driven by your DAX measures.
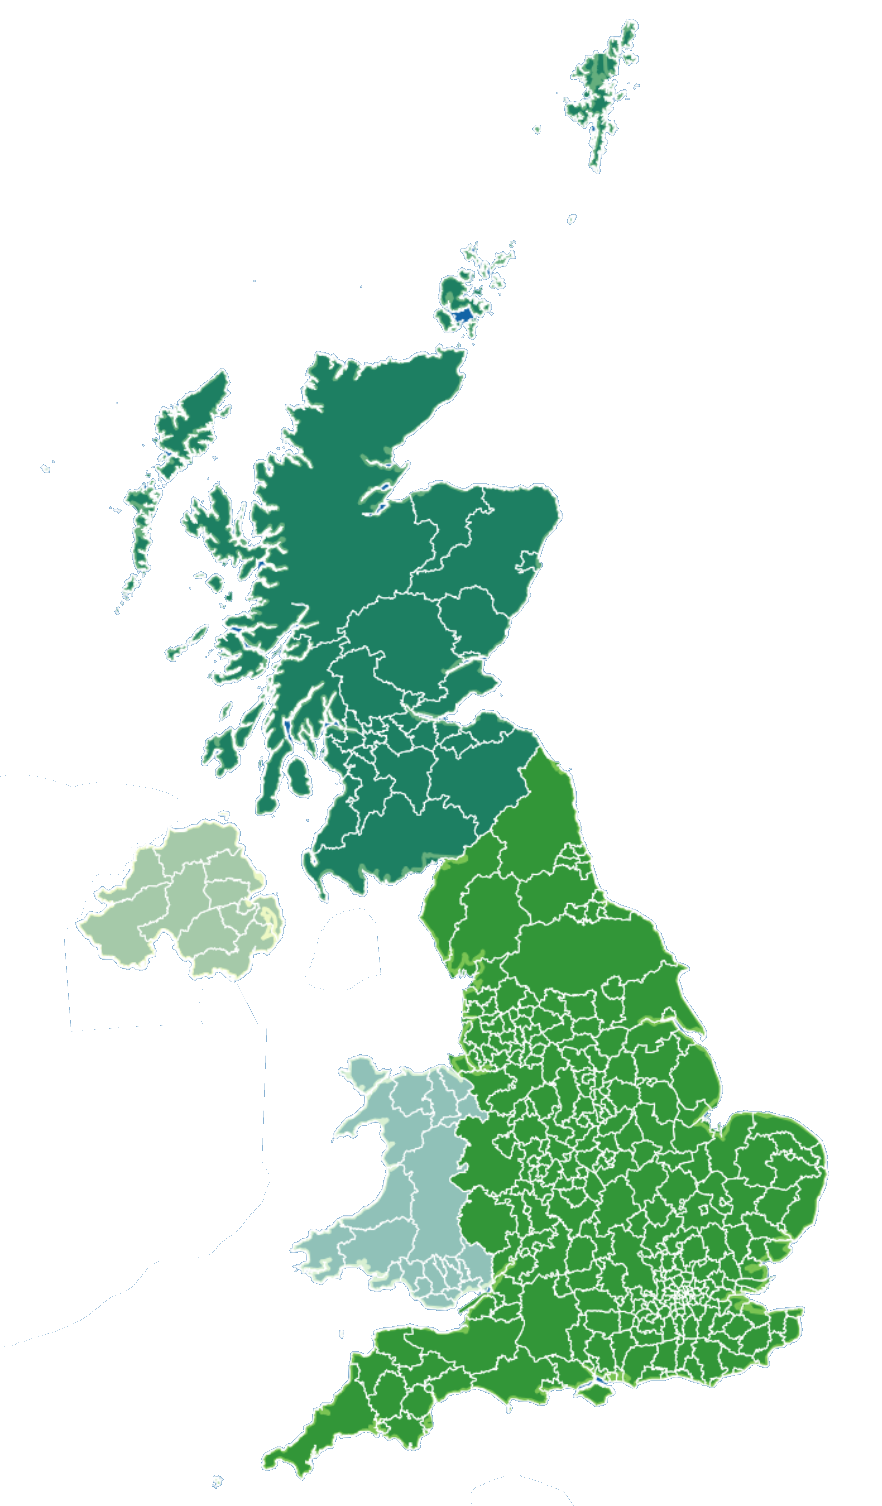
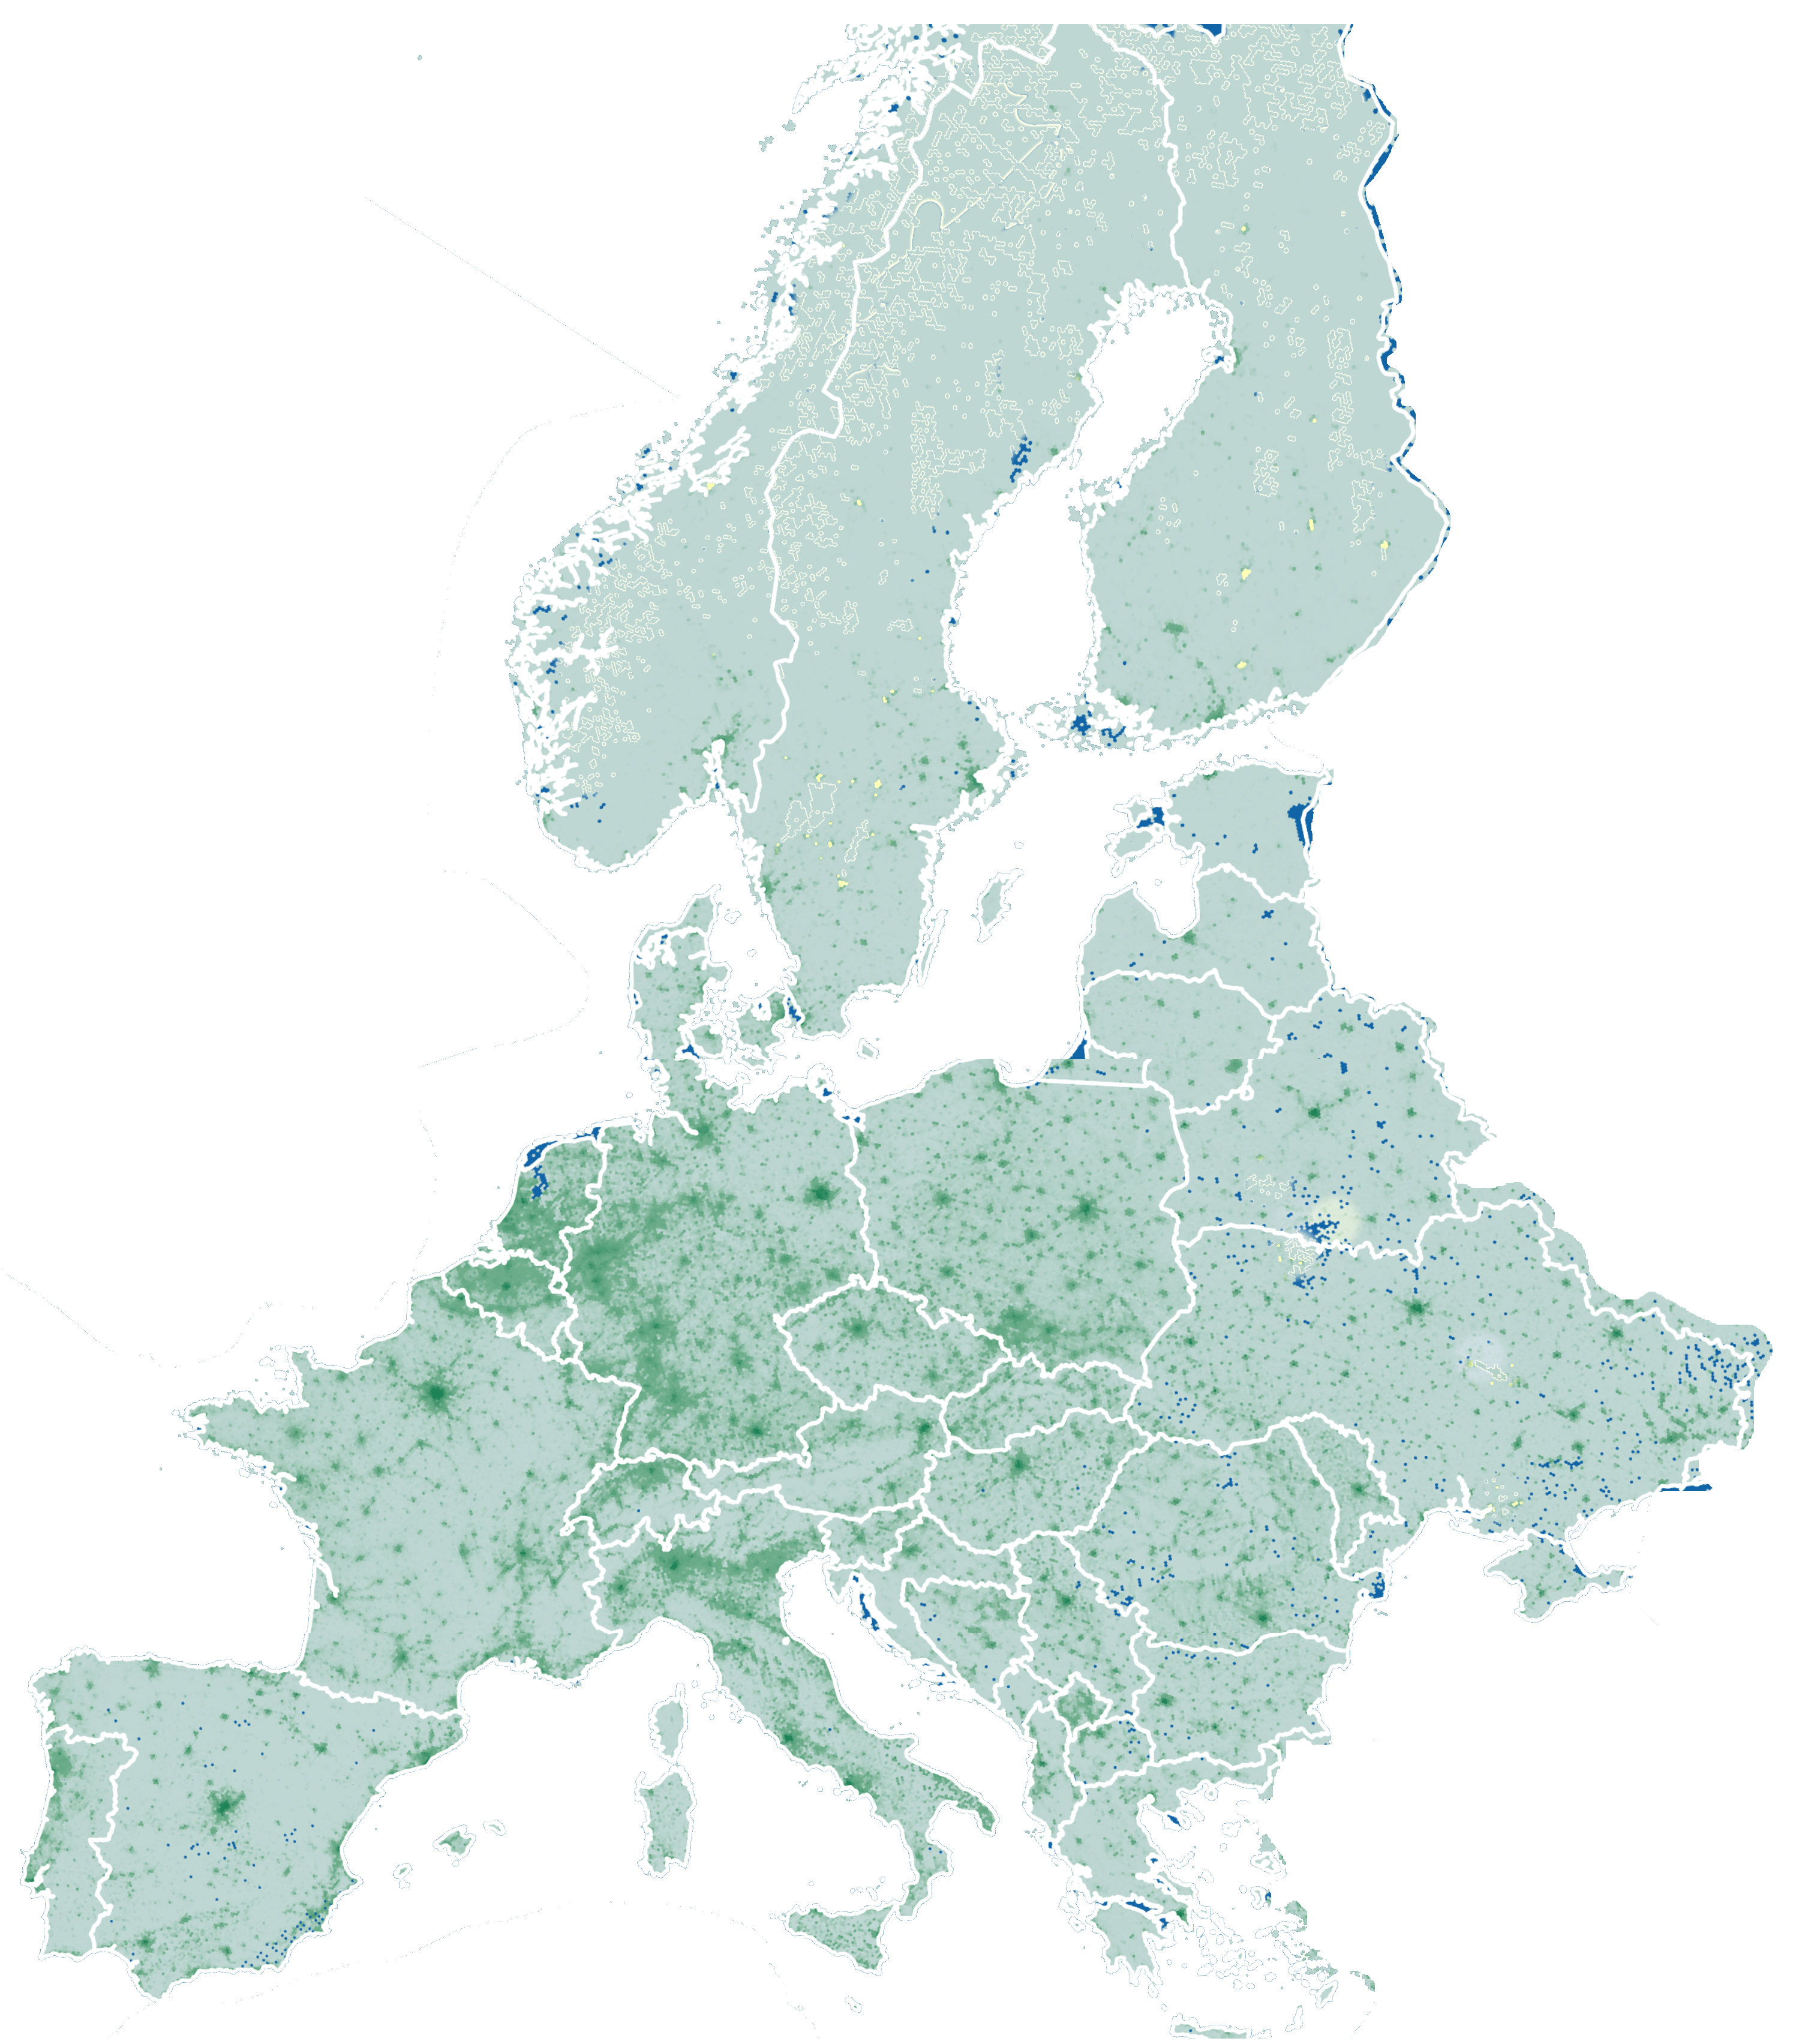
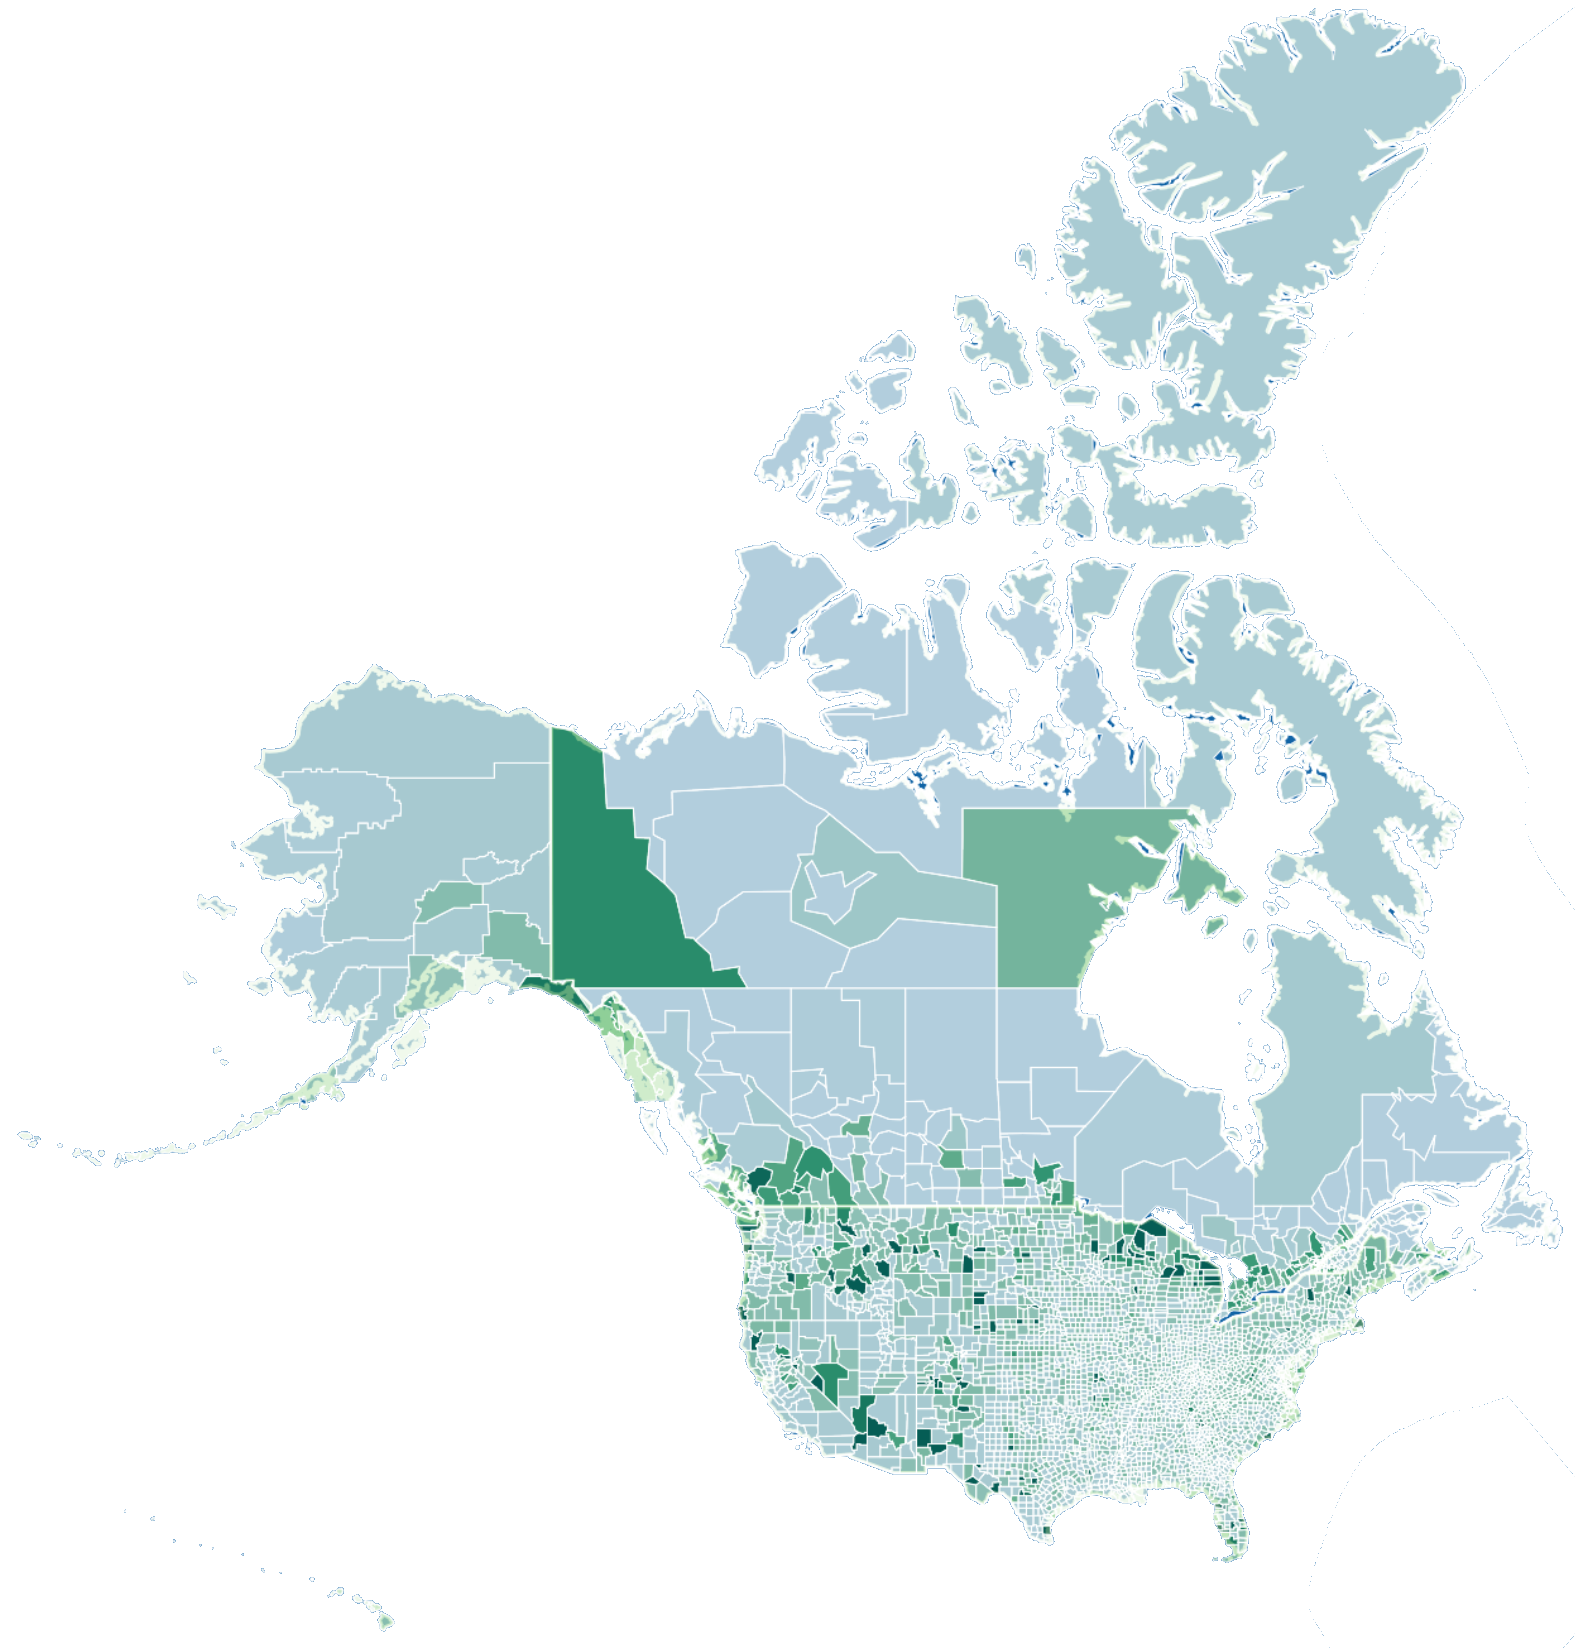
- Choropleth maps of sales by postcode, region or local authority
- KPI overlays on catchments, NUTS regions or census tracts
- Rule-based styling, dynamic labels and tooltip enrichment