Why Icon Map for Utilities & Telecoms?

Icon Map turns routine operational and customer data inside Power BI or Microsoft Fabric into location-aware insight, driving safer networks, happier customers, and stronger returns.

Infrastructure Performance & Service Reliability

Leverage real-time geospatial visualization to streamline network operations, enhance asset resilience, and proactively manage field activities. Spatial analytics across historical and live data improve service uptime, safety, and regulatory compliance.

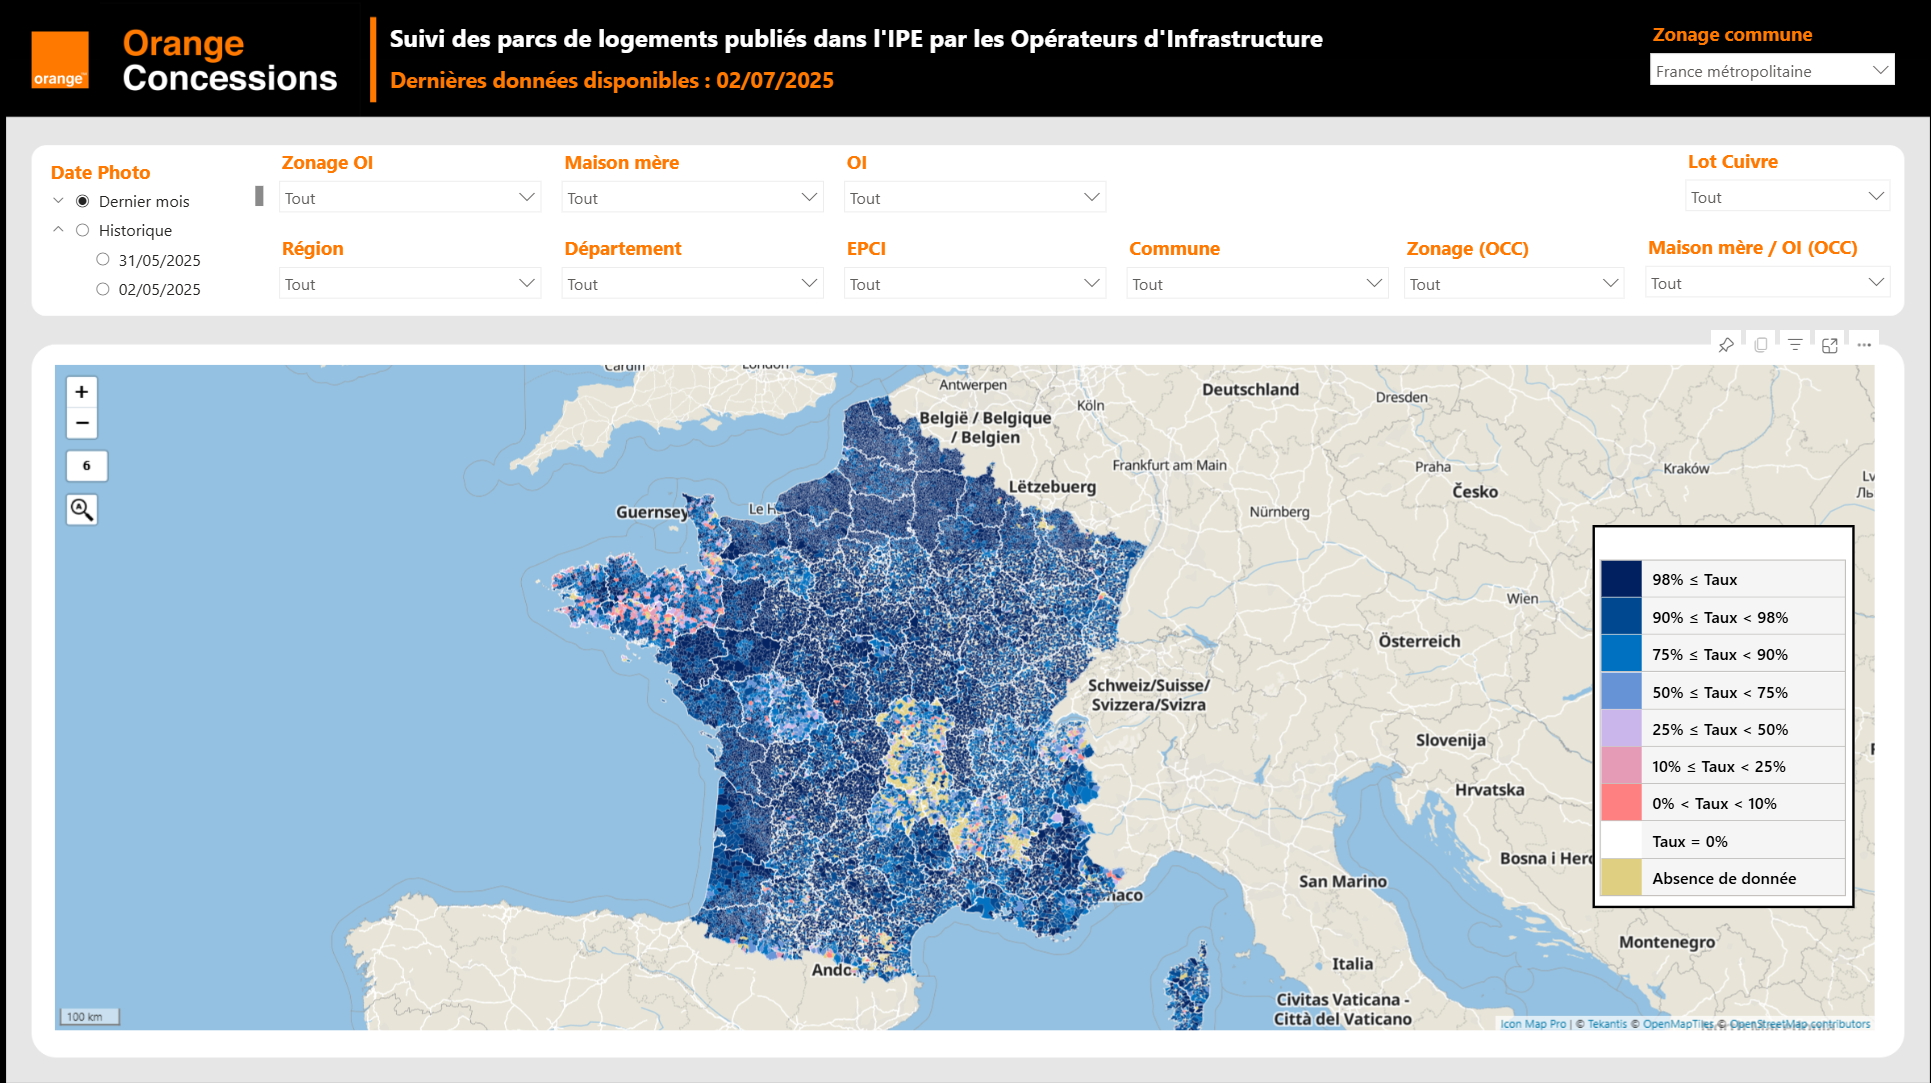
Outage & fault heat-maps

Visualize live incident density to dispatch crews promptly, cut downtime, and improve customer updates.

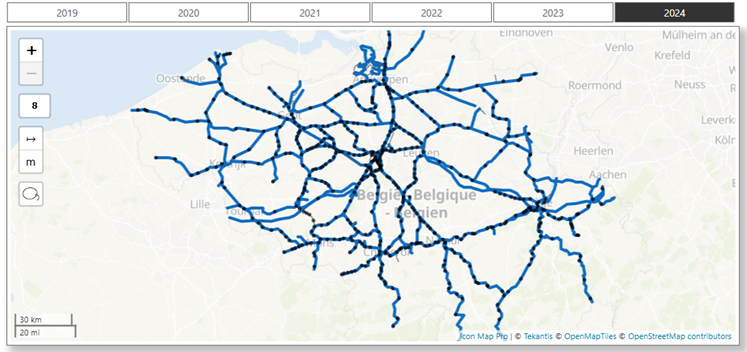
Real-time load & capacity mapping

Monitor network flow, pressure, or bandwidth in context, preventing overloads and balancing demand dynamically.

Predictive maintenance hotspots

Identify assets with rising failure risk, schedule works ahead of time and reduce emergency call-outs.

Field crew routing & job status

Map crew locations, optimize travel, and track task progress for faster restoration and lower costs.

Asset age & risk visualization

Reveal aging pipes, cables, or masts spatially, prioritizing renewal investment where risk is highest.

Energy & sustainability dashboards

Track consumption, leakage, and carbon intensity across estates, supporting net-zero and ESG targets.

Customer Insights & Revenue Optimization

Leverage real-time geospatial visualization to streamline network operations, enhance asset resilience, and proactively manage field activities. Spatial analytics across historical and live data improve service uptime, safety, and regulatory compliance.

Demand & consumption segmentation

Map usage patterns by customer type, tailoring tariffs, efficiency programs, and marketing.

Service coverage / travel-time gaps

Quantify underserved areas, justify network expansion, and improve universal service compliance.

New service uptake forecasting

Combine property development and demographic trends to prioritize fiber roll-outs or smart-meter installs.

Churn & complaint hotspot mapping

Detect areas with high cancellations or faults, target service improvements, and boost satisfaction.

Competitor network overlay analysis

Visualize rival infrastructure to inform pricing, partnership, and merger decisions.

Climate resilience & adaptation modeling

Present portfolio-level views with instant drill-down to project KPIs, supporting evidence-based funding cases.

Why Choose
Icon Map?

Our customer success stories

Optimizing Christmas Eve: How Santa Uses Icon Map to Put Every Child on the Map screenshot

Optimizing Christmas Eve: How Santa Uses Icon Map to Put Every Child on the Map

North Pole Logistics is the exclusive global operator responsible for delivering presents to children who celebrate Christmas. Operating from a single distribution center at the North Pole, the organization must reach more than 900 million homes in one extend…

Enhancing Fiber Deployment and Commercialization with Icon Map Pro at Orange Concessions screenshot

Enhancing Fiber Deployment and Commercialization with Icon Map Pro at Orange Concessions

Orange Concessions is the leading public-private fiber network operator in rural France. Through long-term public service delegation contracts, it manages a rapidly expanding network infrastructure designed to bring high-speed broadband access to underserved…

Transforming Rail Safety: The Power of Location Intelligence in Action at SNCB screenshot

Transforming Rail Safety: The Power of Location Intelligence in Action at SNCB

Safety is a cornerstone of SNCB’s operational strategy. As Belgium’s national railway operator, SNCB places significant emphasis on the safety and security of both passengers and staff. CEO Sophie Dutordoir recently stated that all employees' work "deserves r…