Heat map
Icon Map Pro has the ability to create heat maps from point data. Heatmaps are supported in both standard and WebGL rendering modes.
Data setup
To configure the data well for a heatmap, the following fields should be populated:
- ID - unique ID for that location and item
- Longitude
- Latitude
- Heatmap weight - the value for that location
Sample data
| ID | Longitude | Latitude | Destination Longitude | Destination Latitude | Circle Size | Cluster Group | H3 Weight | Heatmap Weight | Image / WKT / GeoJSON | Feature Reference | Feature Weight |
|---|---|---|---|---|---|---|---|---|---|---|---|
| ID1 | -2.576 | 51.481 | null | null | null | null | null | 45 | null | null | null |
| ID2 | -2.576 | 51.481 | null | null | null | null | null | 62 | null | null | null |
| ID3 | -2.955 | 51.332 | null | null | null | null | null | 41 | null | null | null |
| ID4 | -2.155 | 51.632 | null | null | null | null | null | 12 | null | null | null |
Heatmap configuration
The configuration options available depend on whether WebGL rendering mode is enabled or not.
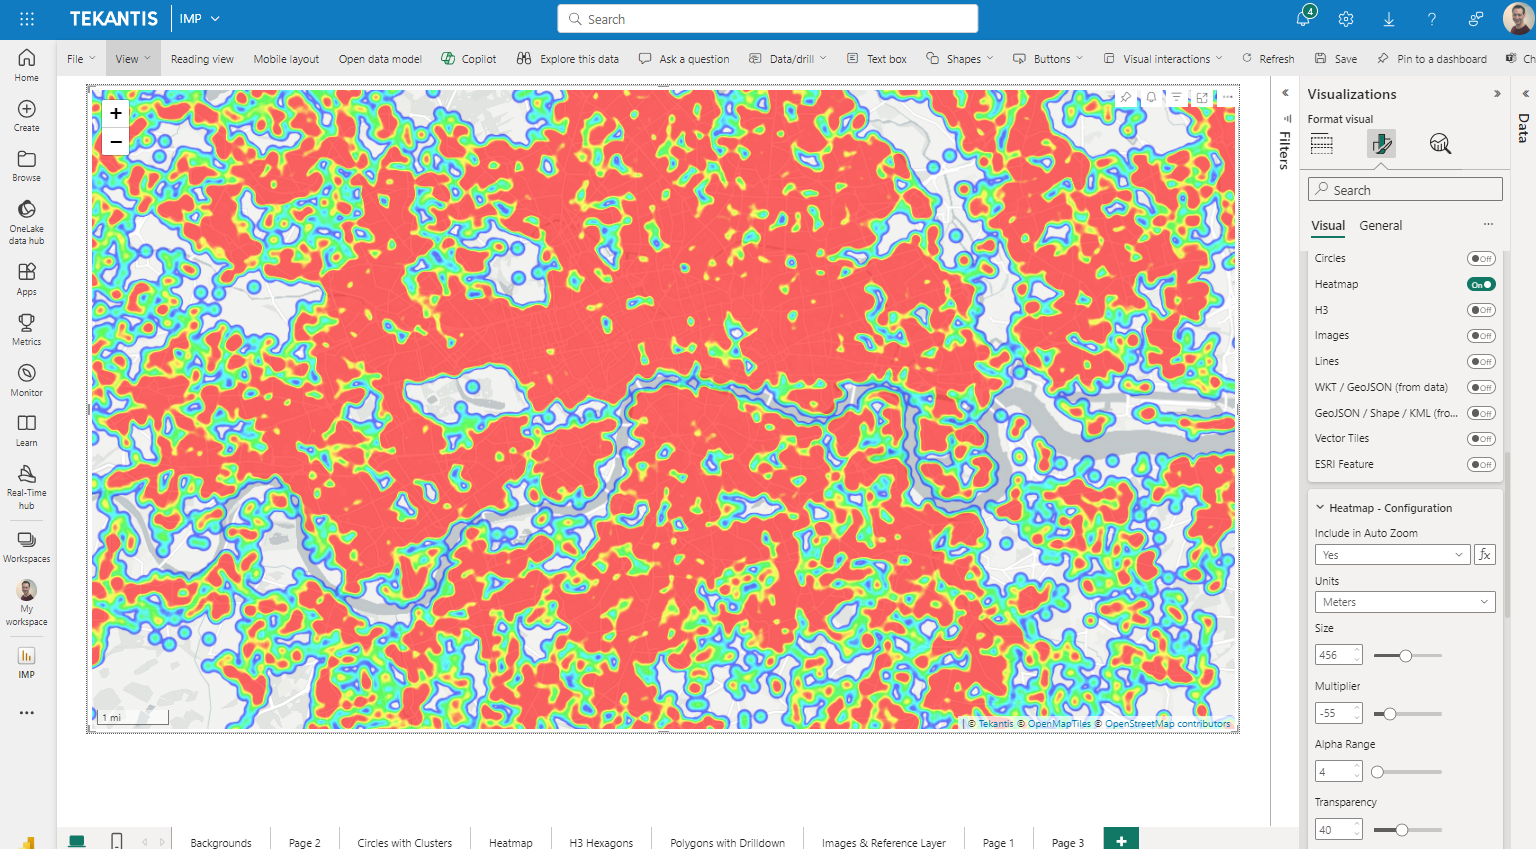
Standard rendering mode
Include in Auto Zoom
Whether that item should be included when the map zooms to data-bound locations. This field can be set using a measure of field value of yes or no set with conditional formatting, to include or exclude specific rows of data.
Units
This dropdown can be set to:
- Pixels - The heatmap will be based on pixels on the screen, and therefore change as you zoom in and out on the map, with points becoming more sparse as you zoom.
- Meters - The heatmap will be based on coverage on the ground, and therefore be static as you zoom in and out, with the same amount of area shaded.
The option selected here will impact how you configure the following three options in order to achieve an appropriate heatmap.
Size
How much area each point covers.
Multiplier
The intensity values of points.
Alpha Range
At which point the heatmap takes effect.
WebGL rendering mode
When WebGL rendering is enabled, the heatmap provides GPU-accelerated rendering and smooth zoom-level interpolation.
Display Min Zoom / Display Max Zoom
Controls the zoom range at which the heatmap layer is visible on the map (0–24).
Radius (Zoomed Out) / Radius (Zoomed In)
Sets the heatmap point radius in pixels at low and high zoom levels. The radius interpolates smoothly between these values as the user zooms.
Advanced Settings
Enabling the Advanced Settings toggle reveals three additional sub-groups for fine-tuning the heatmap behavior at different zoom levels:
- Heatmap - Weight: Controls how data values are mapped to heatmap weight across zoom levels, with Zoomed Out At and Zoomed In At breakpoints.
- Heatmap - Radius: Provides full control over radius zoom breakpoints and values, with separate Zoomed Out At/Zoomed In At zoom levels and corresponding radius values.
- Heatmap - Intensity: Controls the intensity multiplier across zoom levels, with separate Zoomed Out At/Zoomed In At zoom levels and corresponding intensity values.
Common settings
Include in Auto Zoom
Whether heatmap points should be included when auto-fitting the map bounds.
Transparency
How transparent the heatmap is.
Z-Index
The order in which the layer appears vs other layers. Note that items below the heatmap layer will not be interactive (ie can not be selected or show tooltips).
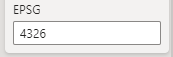
EPSG (Coordinate Reference System)
Allows you to specify a specific reference system for your coordinates. The default used is EPSG:4326 / WGS84 and expects longitude and latitude coordinates. You can use other coordinate systems by specifying the relevant EPSG number. For example, to use British National Grid coordinates, enter 27700. Other EPSG codes can be found here.
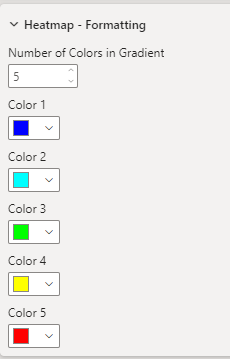
Heatmap Formatting
It is possible to configure up to 5 colors to use in the Heatmap color gradient: