
Making geospatial data easier to use in Power BI
Anyone who has tried to build maps in Power BI knows that the hardest part often comes before the analysis even begins. It usually starts with a search for data, and you find a dataset that might work only to discover it is a massive boundary file.
The work then begins. The file needs converting and simplifying so it’s small enough to bring into Power BI, but then you’ve lost the detail when you zoom in. By the time you are ready to analyze anything, a surprising amount of time has already been spent simply preparing the data. The strange thing is that thousands of people are doing exactly the same work.
The same datasets, prepared again and again
While working with customers, we noticed a pattern. Different organizations, often in completely different sectors, were repeatedly preparing the same spatial datasets. A local authority might spend weeks preparing deprivation indices to map alongside library locations or school catchment areas, only for another authority to do the exact same thing.
Across hundreds of organizations, this adds up to years of duplicated effort spent preparing identical data. It raises a simple question: what if that work only had to be done once?
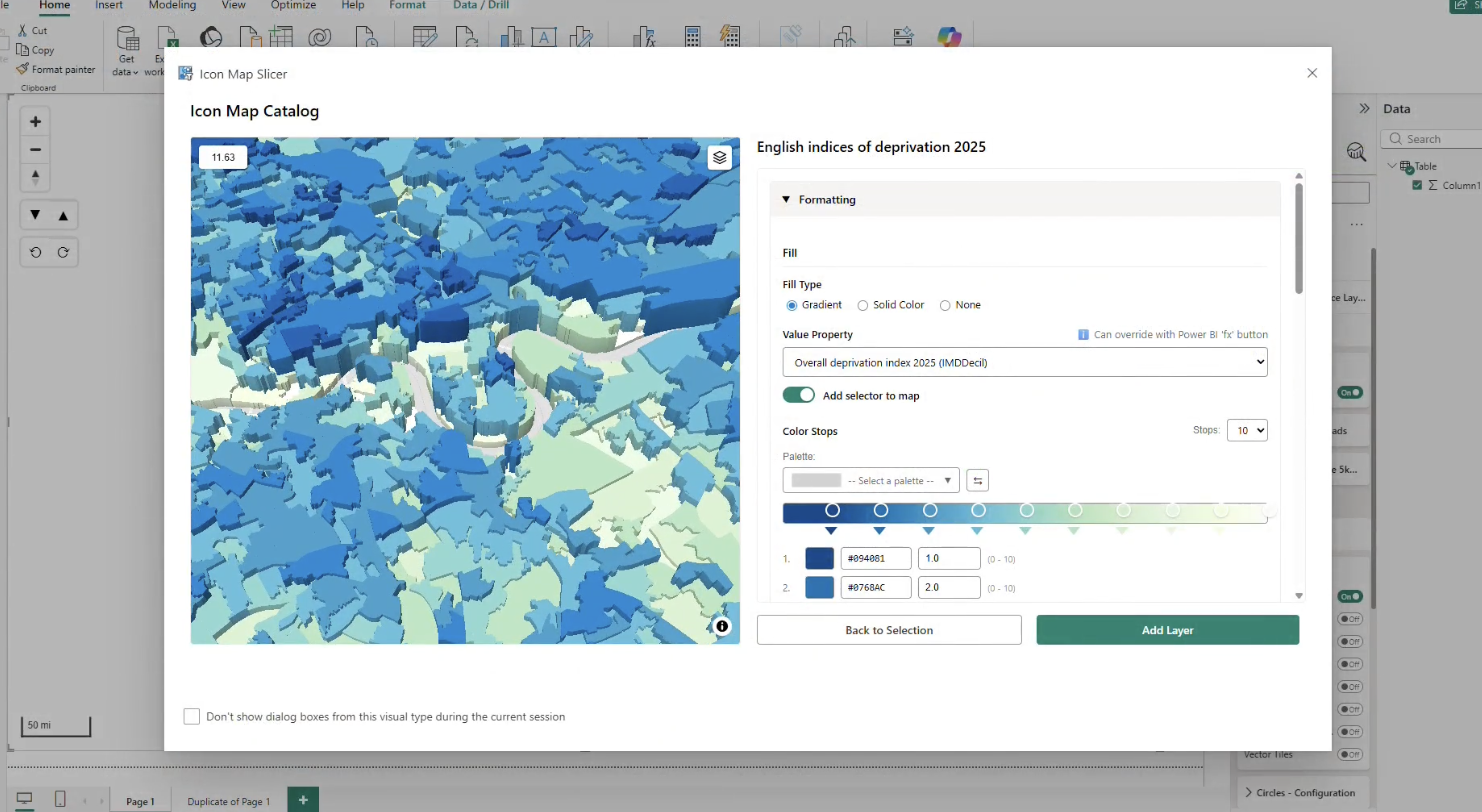
Introducing Icon Map Catalog
Icon Map Catalog is our answer to that question. It is a repository of ready-to-use geospatial datasets built directly into Icon Map. Instead of searching for data and wrestling with large boundary files, you can browse the Catalog, choose the dataset you need, and add it to a map and join it to your Power BI data in just a few clicks.
The goal is straightforward: remove the friction of data preparation so analysts can focus on the insight.
Adding geographic context in seconds
Power BI reports become far more valuable when organizational data is viewed alongside wider geographic context. A council might map service locations against deprivation indices, a logistics company could explore delivery performance against population density, or an insurance provider might examine flood zones and environmental hazards.
With Icon Map Catalog, these layers can be added in seconds. Instead of spending days on data preparation, analysts can focus on exploring the patterns that actually matter.
Built for real analytical workflows
A key goal was to ensure the Catalog fits naturally into how people already build reports. Users still bring their own operational data into Power BI, while the Catalog provides the geographic layers that add context.
These layers can be filtered, styled and combined with existing datasets to explore the relationship between operational activity and geographic factors. Crucially, the datasets are already optimized to perform efficiently within Power BI while preserving the spatial detail needed for meaningful analysis.
A growing library of geospatial datasets
The Catalog already contains hundreds of datasets, including administrative boundaries, census areas, population data, infrastructure networks and environmental risk layers.
This is only the starting point. If a dataset is not yet available, users can request it directly, allowing the library to grow based on real demand and ensuring the most useful datasets are prioritized.
A simpler starting point for spatial analysis
The biggest barrier to using maps is often not the visualization itself but the work required to get the spatial data ready in the first place.
Icon Map Catalog is designed to remove that effort. By making common geospatial datasets easy to find and use, analysts can spend less time preparing data and more time exploring it. That shift is often where the real value of location intelligence begins.
If you would like to explore the available datasets, you can browse the Catalog here: https://www.icon-map.com/products/catalog/