
Day 4 of the 30 Day Map Challenge brings us to the topic of "my data".
Map something personal using your own dataset. Visualize GPS traces, your commute, or a unique, small dataset you created. (Need simple data? Try geojson.io)
For today's challenge I've revamped last year's "my data" challenge. Last year I loaded in my Strava cycling history for a few days in Wales and displayed it using Icon Map Pro. If you're wondering why I'm revisiting this, well Icon Map Slicer brings us an exciting new capability - 3D terrain. With Icon Map Slicer we can really understand the gradient of the climbs and descents.
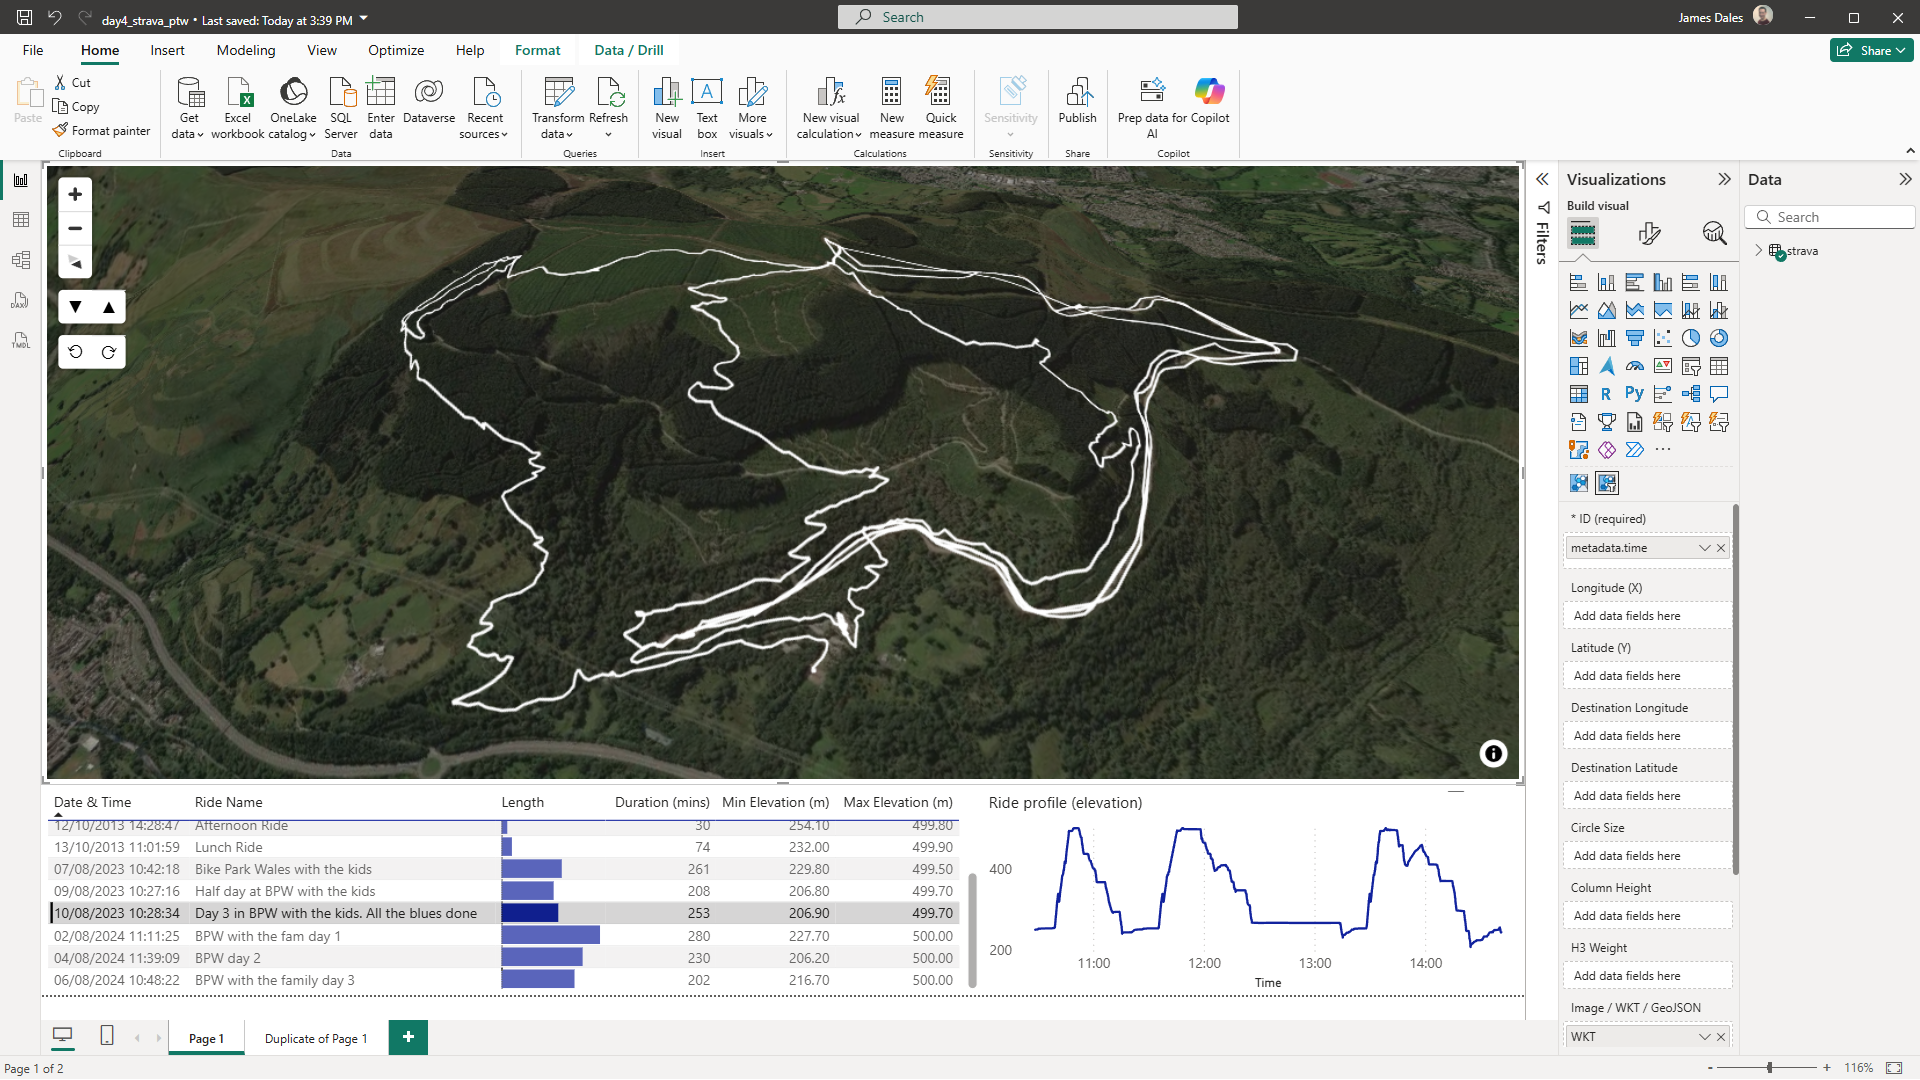
In the screenshot above I've also added a raster reference layer incorporating satellite mapping from MapTiler. As I didn't want to make my API Key public, I've used Icon Map Slicer's built in OS Open Zoomstack maps with added hill shading for the downloadable version.
Enabling 3D terrain in Icon Map Slicer is super easy, it's just an on/off toggle in the background map settings. You can use one of the built in digital elevation models, or use your own.
Here's the end result. Click on the rides in the table to zoom in and either use the UI controls, or hold both mouse buttons to drag the map around in 3D.
You can download the Power BI .pbix file to see see how it was created.