
Introduction
Maps that use gradient color schemes can be excellent for showing patterns, but they are also one of the easiest ways to mislead your audience by accident. A gradient legend is not decoration: it is part of the measurement system of your report.
This article shows a practical, report-author-friendly approach to building a multi-stop gradient legend in Power BI (more than just min, mid, and max) that stays aligned with your map colors.
Why gradient legends go wrong in reports
The most common failures are:
- Legend range drift: the legend looks like “0 to 100”, but filters change the data and the visual silently re-scales
- Outliers flatten everything: one extreme value stretches the color range, so 95% of your features look the same color
- Hidden midpoints: diverging scale (below / above target) needs an explicit center, not a vague “somewhere in the middle”
- Legend does not match conditional formatting: the map uses custom rules, but the legend is based on something else.
The fix is straightforward in principle: define your color logic once, then reuse it everywhere.
Design your color scale first
Before you build anything, decide what your colors mean and how the legend should behave:
Bounds: fixed vs dynamic
- Fixed bounds are best when users compare across time or categories (consistent meaning).
- Dynamic bounds are best for exploration (responsive to filters), but can confuse comparisons.
Sequential scales are best for magnitude (low → high).
Diverging scales are best for “below/above target”. Choose a neutral midpoint and use symmetric stops.
Palette and accessibility: use color-blind safe palettes, check contrast, and avoid relying on red/green alone.
Build one “source of truth” for colors (multi-stop conditional formatting)
Create a disconnected Stops table (DAX calculated table or Power Query) that defines your range. For fixed-range legends, store fixed bounds; for dynamic legends, compute labels from [Legend Min] and [Legend Max].
Typical fields are:
- StopIndex (1..n)
- Offset (0..1 position along the bar – it defines where each stop appears in the gradient 0 to 1)
- MinValue and MaxValue (recommended for banding), or a single Value (upper bound) if you prefer
- Hex (fill color)
- LabelSVG (label text to display in the SVG). Labels can be blank for intermediate stops or present for every stop
- LabelSVGHex (label text color for contrast)
Legend Stops Fixed =
DATATABLE(
"StopIndex", INTEGER,
"Offset", DOUBLE, -- 0 to 1
"Value", DOUBLE, -- Fixed min value (useful for fixed-range legends)
"Hex", STRING, -- Hex code for each stop
"LabelSVG", STRING, -- Stop Label used in SVG
"LabelSVGHex", STRING, -- Stop Label Hex colour
{
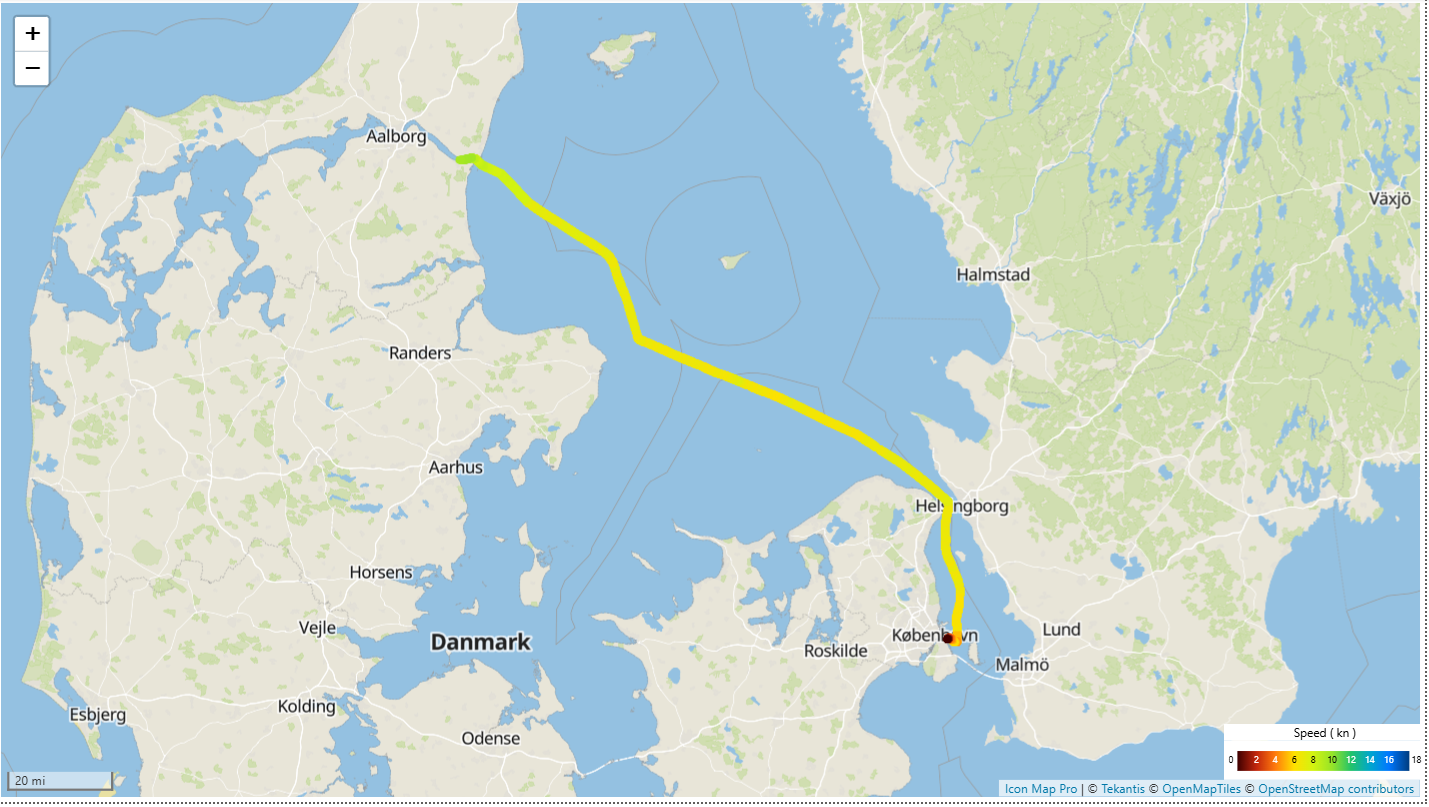
{ 1, 0.00, 0, "#3E0000", "0", "#FFFFFF" },
{ 2, 0.11, 2, "#C1250D", "2", "#FFFFFF" },
{ 3, 0.22, 4, "#FF7A0C", "4", "#FFFFFF" },
{ 4, 0.33, 6, "#FFE000", "6", "#000000" },
{ 5, 0.44, 8, "#D3F311", "8", "#000000" },
{ 6, 0.55, 10, "#97E428", "10", "#000000" },
{ 7, 0.66, 12, "#23C369", "12", "#FFFFFF" },
{ 8, 0.77, 14, "#00A7CB", "14", "#FFFFFF" },
{ 9, 0.88, 16, "#0078FF", "16", "#FFFFFF" },
{ 10, 1.00, 18, "#003C7F", "18", "#FFFFFF" }
}
)
Write a DAX ‘color’ measure for conditional formatting
Next, write a DAX color measure that the map will use for conditional formatting. The goal is to interpolate RGB values between stops so you get a smooth gradient between each defined color.
The example below assumes a fixed sequential range (for example 0 to 18). It uses helper logic and user-defined functions to convert hex to decimal RGB, interpolate, then converts back to hex.
NB: You need to enable the 'Dax user defined functions' feature under the Preview options within Power BI Desktop.
Instead of using the DAX user defined functions you could use the DAX measures from this article that Phil Seamark wrote a few years ago for doing the HexToInt and IntToHex conversions.
https://dax.tips/2019/10/02/dax-base-conversions/
Legend Colour Hex ( Interpolated ) - Fixed =
VAR _currentvalue = [Speed]
VAR _minvalue =
    MAXX (
        TOPN ( 1, ALL ( 'Legend Stops Fixed' ), 'Legend Stops Fixed'[StopIndex], ASC ),
        'Legend Stops Fixed'[Value]
    )
VAR _maxvalue =
    MAXX (
        TOPN ( 1, ALL ( 'Legend Stops Fixed' ), 'Legend Stops Fixed'[StopIndex], DESC ),
        'Legend Stops Fixed'[Value]
    )
VAR _factor = DIVIDE ( _currentvalue - _minvalue, _maxvalue - _minvalue )
VAR _factorclamped = MIN ( 1, MAX ( 0, _factor ) )

-- Pick the segment [lo, hi] and the endpoint colors
VAR _lower =
    TOPN (
        1,
        FILTER ( 'Legend Stops Fixed', 'Legend Stops Fixed'[Offset] <= _factorclamped ),
        'Legend Stops Fixed'[Offset], DESC,
        'Legend Stops Fixed'[StopIndex], DESC
    )
VAR _upper =
    TOPN (
        1,
        FILTER ( 'Legend Stops Fixed', 'Legend Stops Fixed'[Offset] >= _factorclamped ),
        'Legend Stops Fixed'[Offset], ASC,
        'Legend Stops Fixed'[StopIndex], ASC
    )

VAR _xlo = MAXX ( _lower, 'Legend Stops Fixed'[Offset] )
VAR _xhi = MAXX ( _upper, 'Legend Stops Fixed'[Offset] )
VAR _clo = MAXX ( _lower, 'Legend Stops Fixed'[Hex] )
VAR _chi = MAXX ( _upper, 'Legend Stops Fixed'[Hex] )

-- Position within the segment (0..1)
VAR _position = DIVIDE( _factorclamped - _xlo, _xhi - _xlo, 0 )

-- Convert Hex to RGB for [lo, hi] colours
VAR _rlo = EvaluationContext.Colour.Hex.ToInt ( MID ( _clo, 2, 2 ) )
VAR _glo = EvaluationContext.Colour.Hex.ToInt ( MID ( _clo, 4, 2 ) )
VAR _blo = EvaluationContext.Colour.Hex.ToInt ( MID ( _clo, 6, 2 ) )

VAR _rhi = EvaluationContext.Colour.Hex.ToInt ( MID ( _chi, 2, 2 ) )
VAR _ghi = EvaluationContext.Colour.Hex.ToInt ( MID ( _chi, 4, 2 ) )
VAR _bhi = EvaluationContext.Colour.Hex.ToInt ( MID ( _chi, 6, 2 ) )

-- Interpolate each channel
VAR r = ROUND ( _rlo + ( _rhi - _rlo ) * _position, 0 )
VAR g = ROUND ( _glo + ( _ghi - _glo ) * _position, 0 )
VAR b = ROUND ( _blo + ( _bhi - _blo ) * _position, 0 )

-- Convert RGB to Hex
VAR _rHex = EvaluationContext.Colour.Int.ToHex ( r, 2 )
VAR _gHex = EvaluationContext.Colour.Int.ToHex ( g , 2 )
VAR _bHex = EvaluationContext.Colour.Int.ToHex ( b , 2 )

-- Concatenate Hex values
VAR result = "#" & _rHex & _gHex & _bHex

RETURN
    result
Practical tips
- Test performance: measures used in conditional formatting can be evaluated many times; keep them efficient.
- Handle blanks: decide whether blanks are transparent, gray, or excluded.
- Manage outliers: clamp values and/or use percentiles if the distribution is skewed.
- Keep stops sensible: more stops can improve meaning, but too many can hurt readability and add overhead.
Create an SVG gradient legend with multiple stops
Build an SVG ‘legend’ measure that outputs a horizontal (or vertical) gradient bar:
- A
<linearGradient>with multiple<stop offset="…">entries from your Stops table - Tick marks and labels generated from the same Stops table, so edits don’t require rewriting the SVG measure
Legend SVG ( Interpolated ) - Fixed =
-- Constants
VAR _svgwidth = 1750
VAR _svgheight = 180
VAR _barX = 80
VAR _barY = 2
VAR _barW = 1540
VAR _barH = 178

VAR _fontfamily = "Segoe UI"
VAR _fontweight = 400
VAR _fontsize = 80

-- Middle position of labels adjusted relative to _barY / _barH
VAR _midY = _barY + (_barH / 2)

-- Get the first and last stop values from the lookup table
VAR _firststop =
    TOPN ( 1, ALL ( 'Legend Stops Fixed' ), 'Legend Stops Fixed'[StopIndex], ASC )
VAR _laststop =
    TOPN ( 1, ALL ( 'Legend Stops Fixed' ), 'Legend Stops Fixed'[StopIndex], DESC )

-- Identify first and last stop indices
VAR _firstindex = MAXX ( _firststop, 'Legend Stops Fixed'[StopIndex] )
VAR _lastindex  = MAXX ( _laststop, 'Legend Stops Fixed'[StopIndex] )

-- Text values to be used at start and end of gradient bar
VAR _mintxt = COALESCE ( MAXX ( _firststop, 'Legend Stops Fixed'[LabelSVG] ), "" )
VAR _maxtxt = COALESCE ( MAXX ( _laststop,  'Legend Stops Fixed'[LabelSVG] ), "" )

-- Create Stops table
VAR _stopstable =
    ADDCOLUMNS (
        'Legend Stops Fixed',
        "@StopTag",
            "<stop offset='" &
            FORMAT ( 'Legend Stops Fixed'[Offset], "0.00#" ) &
            "' stop-color='" & 'Legend Stops Fixed'[Hex] & "'/>",
        "@TextTag",
            "<text x='" & FORMAT ( _barX + ( _barW * 'Legend Stops Fixed'[Offset] ), "0.0" ) &
            "' y='" & FORMAT ( _midY, "0.0" ) &
            "' fill='" & COALESCE ( 'Legend Stops Fixed'[LabelSVGHex], "#FFFFFF" ) &
            "'>" & 'Legend Stops Fixed'[LabelSVG] & "</text>"
    )

-- Concatenate Hex codes for the gradient
VAR _stops =
    CONCATENATEX (
        _stopstable,
        [@StopTag],
        "",
        'Legend Stops Fixed'[StopIndex], ASC
    )

-- Labels inside the gradient bar ( excluding first / last, exclude blanks )
VAR _inbartxt =
    CONCATENATEX(
        FILTER(
            _stopsTable,
            NOT ISBLANK ( 'Legend Stops Fixed'[LabelSVG] )
                && 'Legend Stops Fixed'[StopIndex] <> _firstindex
                && 'Legend Stops Fixed'[StopIndex] <> _lastindex
        ),
        [@TextTag],
        "",
        'Legend Stops Fixed'[StopIndex], ASC
    )

VAR _svg =
    "data:image/svg+xml;utf8," &
    "<svg xmlns='http://www.w3.org/2000/svg' width='" & _svgwidth & "' height='" & _svgheight & "'>" &
    "  <defs>" &
    "    <linearGradient id='gradient' x1='0' y1='0' x2='1' y2='0'>" &
            _stops &
    "    </linearGradient>" &
    "  </defs>" &

    -- Gradient bar
    "  <rect x='" & _barX & "' y='" & _barY & "' width='" & _barW & "' height='" & _barH & "' rx='2' ry='2' fill='url(#gradient)' />" &

    -- Mid Stop labels
    "   <g font-family='" & _fontfamily & "' font-weight='" & _fontweight & "' font-size='" & _fontsize & "' text-anchor='middle' dominant-baseline='middle'>" &
        _inbartxt &
    " </g>" &

    -- Start and End labels
    "  <text x='0' y='" & _midY & "' font-family='" & _fontfamily & "' font-weight='" & _fontweight & "' font-size='" & _fontsize & "' fill='#000000' dominant-baseline='middle'>" & _mintxt & "</text>" &
    "  <text x='" & (_barX + _barW + 20) & "' y='" & _midY & "' font-family='" & _fontfamily & "' font-weight='" & _fontweight & "' font-size='" & _fontsize & "' fill='#000000' dominant-baseline='middle'>" & _maxtxt & "</text>" &
    "</svg>"

VAR result = _svg

RETURN
    result
Set the measure’s Data category to Image URL so it renders as an image.
To display the image, use the new Card visual and configure it to show the SVG image (turn off callout text, category label, padding, borders, and background). Place it next to or on top of the map. If overlaying the map, make sure the report maintains the correct layer order.
The downloadable PBIX includes
Stops tables
DAX color measures and SVG legend measures for:
- Fixed bounds (consistent legend meaning)
- Dynamic bounds (legend adapts to filters)
This gives you a reusable multi-stop gradient system you can copy between reports, ensuring the conditonal formatting in your map and legend are always aligned.