
Icon Map
Usage & Instructions
This section provides instructions and guidance on how to use the various features of Icon Map. The ambition is to include a video and downloadable example for each scenario.
Shapes
There are a number of methods for drawing shapes on a map using Icon Map. There are a number of factors to take into consideration when selecting the most appropariate option:
GeoJSON Layers
GeoJSON is a popular format for representing geographic information within a file. (Please note this is GeoJSON rather than TopoJSON as used by Power BI's Shape Map visual). It describes a number of polygons that can be displayed on your map. Icon Map will load a GeoJSON file in its entirely and then display the contents overlayed over the background layers.
GeoJSON layers must be hosted on an external server. The polygons described within the file can then be referenced by items in your Power BI dataset. If a polygon is matched to your data, then it will become interactive and can be used to cross-filter other visuals on your report and adopt conditional formatting. If a polygon is unmatched, then it can still be displayed on your map, but will not be interactive. Please read the detail below as there are some requirements for hosting the geoJSON file externally.
Vector Tiles
Vector Tile support has recently been added to Icon Map. Similar to GeoJSON, it enables polygons to be hosted on an external server and referenced by items in your Power BI dataset. It has a number of major advantages over GeoJSON files. Firstly only the polygons being displayed as you move around the map are requested from the server, and secondly the polygons can become more detailed as you zoom into an area. This overcomes the major restriction with GeoJSON where the detail of the polygons must often be reduced in order to make the file size smaller. Vector layers do limit some features in Icon Map and will require a GIS server such as GeoServer to host the tiles.
Well Known Text (WKT)
Well Known Text (WKT) is a way of representing objects on a map, and are supported by a number of databases including Microsoft SQL Server. Icon Map supports displaying Point, MultiPoint, LineString, MultiLineString, Polygon and MultiPolygon objects, therefore providing good support for the SQL Server Geography datatype. The major difference between WKT support in Icon Map vs GeoJSON and Vector layers is that the shapes are stored within the Power BI dataset iteself, thus removing the need to reference external servers.
GeoJSON
GeoJSON files must be hosted on an external web server. The server must have a valid SSL certificate with so that the files are returned with an address starting HTTPS:// . In addition it is necessary to have CORS enabled. This blog post describes how to host GeoJSON files in Azure Blob storage.
To relate items in your dataset to the shapes in a GeoJSON file, it is necessary to specify provide the 'Category' and 'Size' fields. The value in the 'Category' field should relate to one of the property values in your geoJSON file. For example in this geoJSON example below the category field should contain the text "City of London or E09000001 in order to match the Power BI data with the GeoJSON polygon:
{"type":"FeatureCollection", "features": [
{"type":"Feature","geometry":{"type":"Polygon","coordinates":[[[-0.0855554,51.519815], ... ,[-0.085555,51.5198157]]]},
"properties":{"LAD13CD":"E09000001","LAD13NM":"City of London"},"id":"E09000001"},
]}
Icon Map recognises a row in your data as a candidate for relating to a geoJSON polygon if there is ONLY a 'Category' and 'Size' value present. If you have longitude and latitude fields specified due to have other types of map object, these must have null values to relate these rows to a GeoJSON shape. Whilst the size field is not used for rendering geoJSON shapes, it must still be present. It can be hardcoded to a single value using a measure - eg: geoJSONSize = 1.
GeoJSON Settings
To display a GeoJSON layer, in the visual formatting settings, set the switch to 'on' to enable the GeoJSON settings.
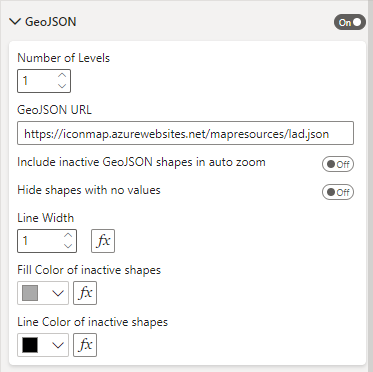
Number of Levels
Icon Map supports up to 5 levels of drill-down to GeoJSON layers. Use this setting to set the number of GeoJSON layers to load. Each layer corresponds to a layer within the drilldown hierarchy. It is not possible to show more than one GeoJSON layer at the same time.
GeoJSON URL
This is the URL of the boundary data or shapes to display on the map. A box will appear for each of the number of levels selected above. It should be in GeoJSON format and include at least one code or description property against each shape that you can relate to the "Category" field in your data. IconMap scans each of the property fields against the data in the category field to look for matches.
Eg: https://iconmap.azurewebsites.net/mapresources/lad.json
If IconMap is unable to access the file, an error message will be displayed. Note: Some webservers will not allow the file to be accessed from another website, due to CORS. If you have control of the web server this can be resolved by adding the Access-Control-Allow-Origin: * response header.
Whilst the file is loading, an icon will be displayed in the top right hand corner of the map. Larger files will take longer to load. It is recommended to simplify your shapes to reduce the file size using a service such as MapShaper.
In order for the layer to appear in the Power BI Service, it must be served from an HTTPS address.
Hide shapes with no values
On: Shapes that do not have a corresponding value in the category field will not be rendered on the map.
Off: Shapes that do not have a corresponding value in the category field will be rendered using the formatting settings below.
Include inactive GeoJSON shapes in auto zoom
On: The map will include inaactive shapes when auto-zooming the map to available data items.
Off: The map will ignore inactive shapes when auto-zooming the map.
Line Width
Width of the shape outlines
Line Color of inactive shapes
Border color for inactive shapes. This color can be defined using expression based formatting but not that the same color will be used for all inactive shapes.
Inactive Fill Color
Fill color for inactive shapes. This color can be defined using expression based formatting but not that the same color will be used for all inactive shapes.
Further examples
Drill-down with dynamic labels
Drill-down through GeoJSON to circles
Drill-down through GeoJSON to circles and images
Vector Tiles
Content coming soon. In the meantime a blog post is available describing the basic functionality.
Well Known Text (WKT)
Well Known Text (WKT) is a way of representing objects on a map, and are supported by a number of databases including Microsoft SQL Server. Icon Map supports displaying Point, MultiPoint, LineString, MultiLineString, Polygon and MultiPolygon objects, therefore providing good support for the SQL Server Geography datatype.
Icon Map requires each object to be on a new row within your dataset, with a unique identifier. The unique ID should be placed in the category field. There must also be a value present in the Size field, although this is not used by Icon Map for Well Known Text. The WKT data should be contained within a field or measure within your Power BI dataset. This is assigned using expression based formatting in the formatting pane under "Objects":
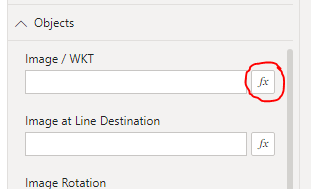
Specific color values for each shape fill and outline can be provided by using the settings in the "Formatting" section.
If you have longitude and latitude fields specified due to having other types of map object, these must have null values to relate these rows to a WKT object.