
On to day 9 of the 30 Day Map Challenge and the topic is "Analog" - time for me to get out the kid's coloring pencils.
Step away from the screen! Create your map using traditional methods (e.g., pen, pencil, paint, collage, physical models). Show the handmade process!
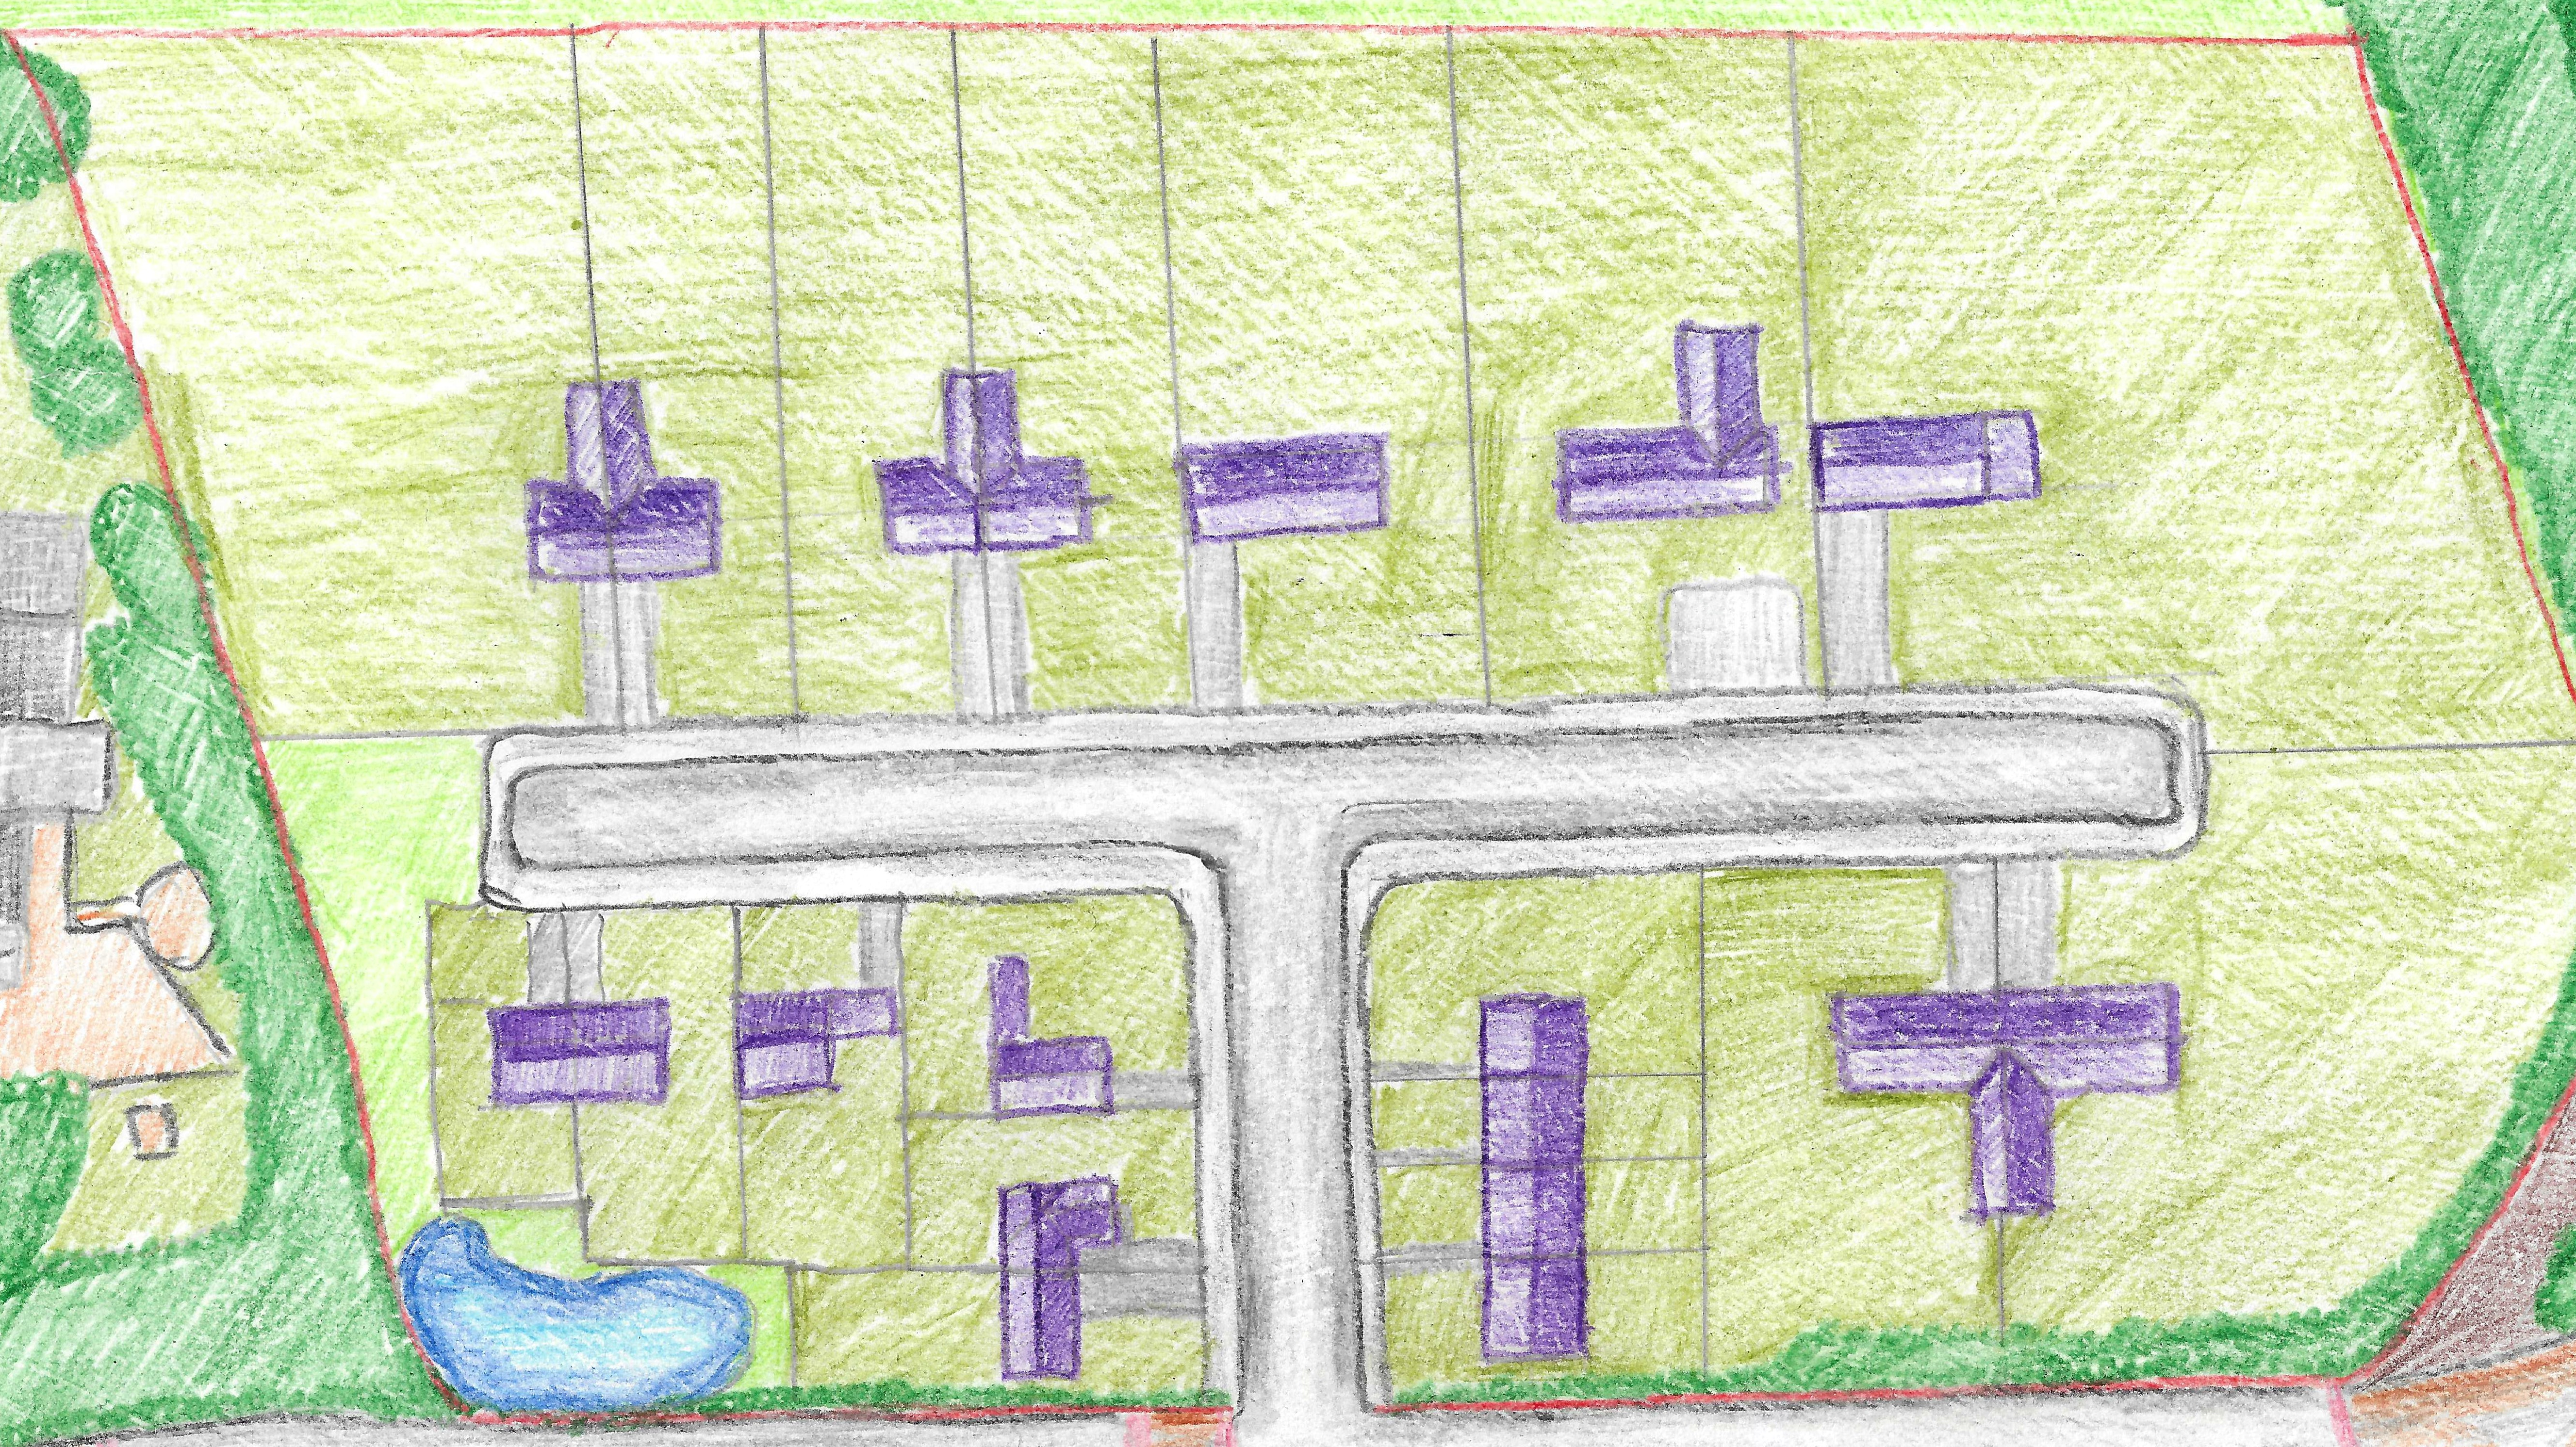
For today's map I've drawn one of those maps you see when housing developers are advertising housing developments that haven't yet been completed - or sometimes even started! It's an artists impression of what that estate will look like.
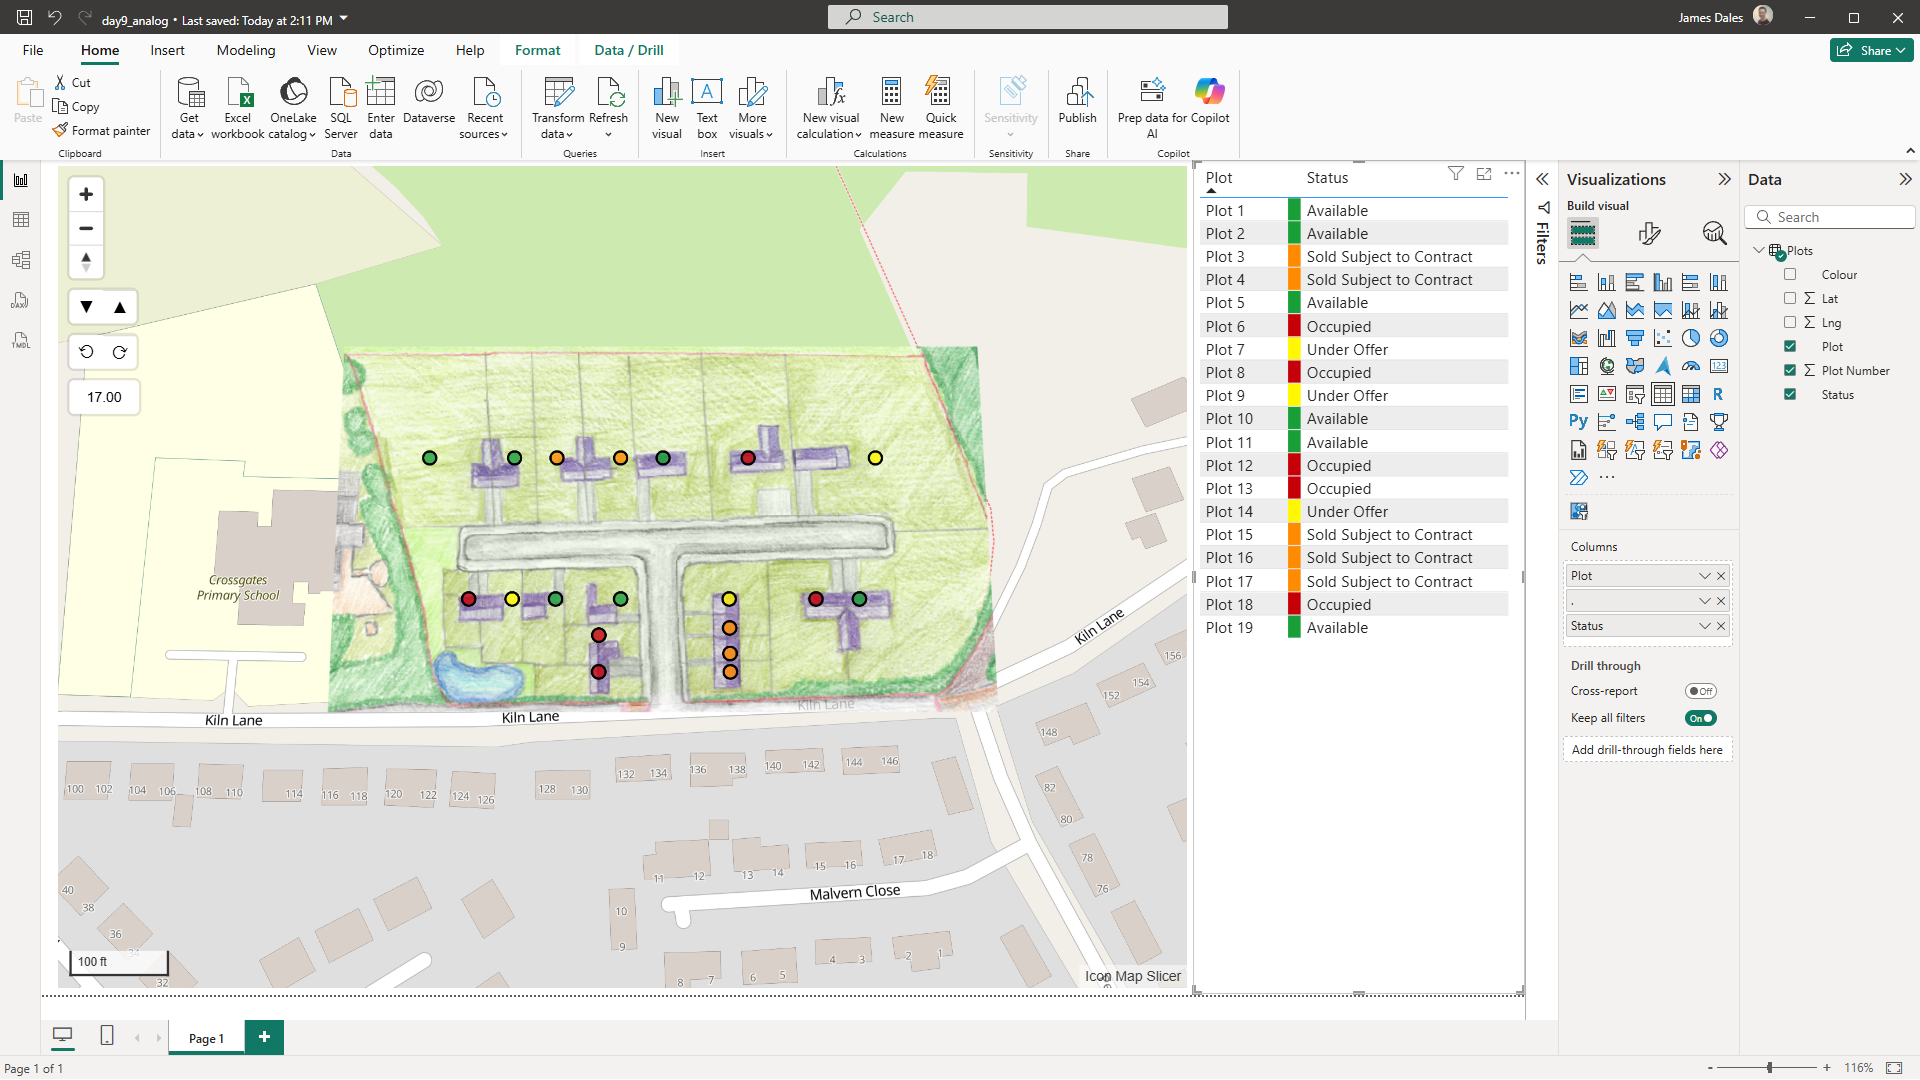
Unfortunately, I'm no artist - but I've had a go. I've found a random farm field near Manchester, and mocked up on a sheet of paper, what it might look like should houses be built there.
Of course I've made a point of using Icon Map Slicer for each of the challenges this month, so I've looked to see how we can get this hand-drawn design onto a map in Power BI, and then add some Power BI data.
Having drawn my housing development, I've scanned it into the computer as a jpeg image.
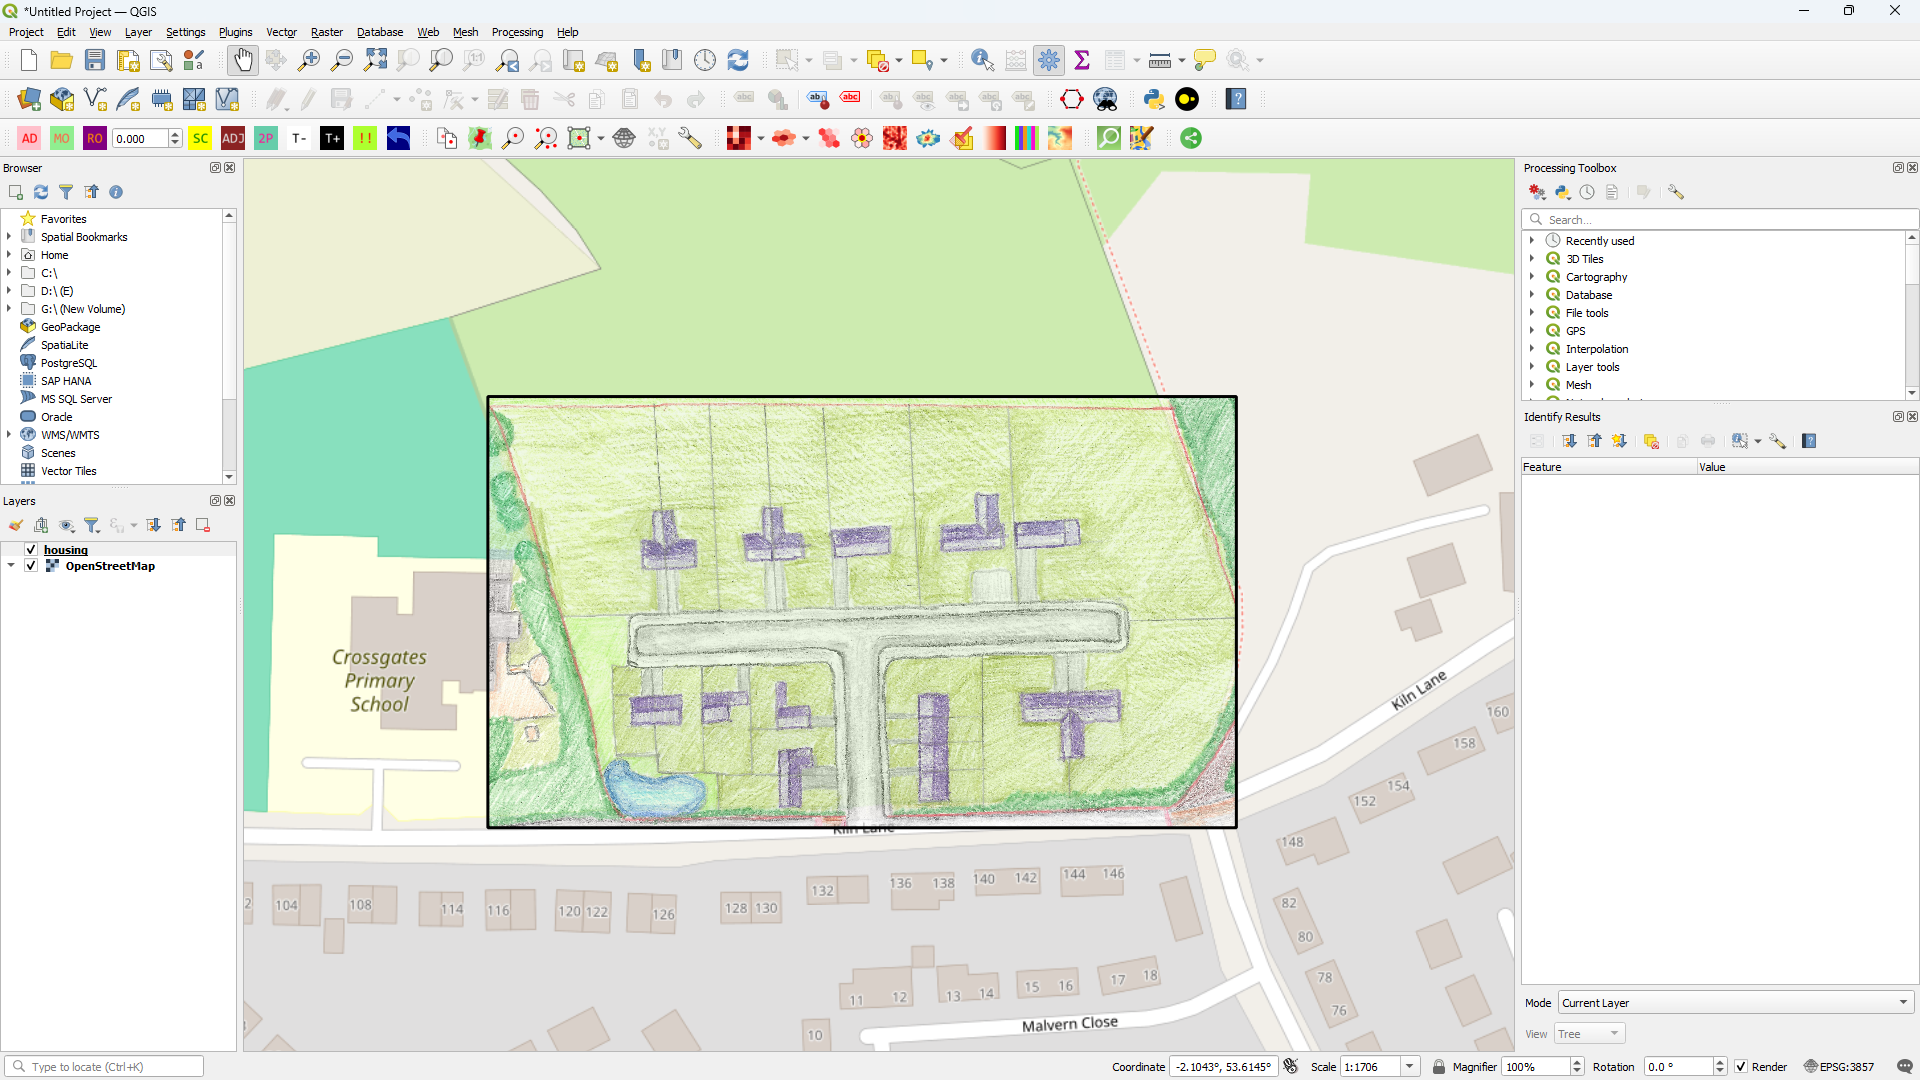
Then, using QGIS and a plugin Freehand Raster Geofencer I've resized and dragged the image to place it onto the real-life plot of land.
I've then exported it as a GeoTIFF. Icon Map Slicer doesn't currently support GeoTIFFs, but it does support the Cloud Optimized GeoTIFF (COG) format. So I've run a quick command to convert it:
gdal_translate housing_georeferenced.tiff housing_cog.tif -of COG
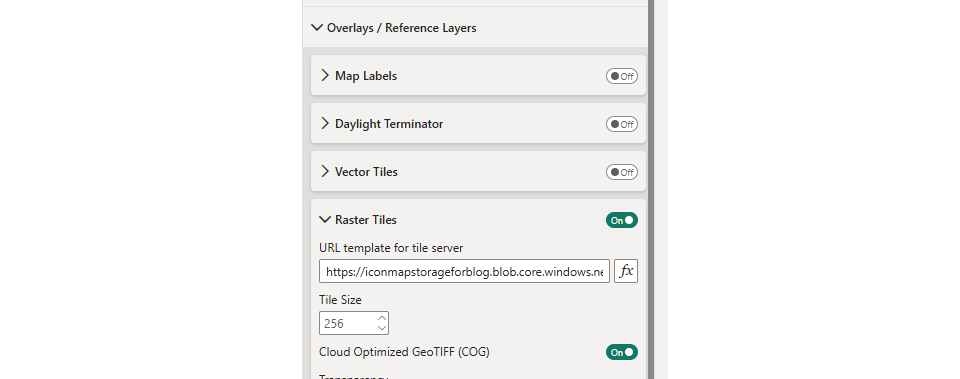
I've then uploaded the COG image to Azure blob storage, and added it as a Raster Overlay Layer in Icon Map Slicer:
Finally I added a quick circle data-bound layer to show the status of the houses.
Here's the resulting report in Power BI:
Here's the .pbix file to download.