
Day 6 of the 30 Day Map Challenge and the topic today is "Dimensions"
Map beyond 2D. Visualize data using 3D models, extrusions (building heights), depth, time (as a dimension), or an unconventional multivariate approach.
While I was tempted to choose "time" and show how to handle boundary changes, I will save that for another time! Instead I wanted to show how Icon Map Slicer can extrude polygons in 3D using height properties, and use them to create indoor building maps.
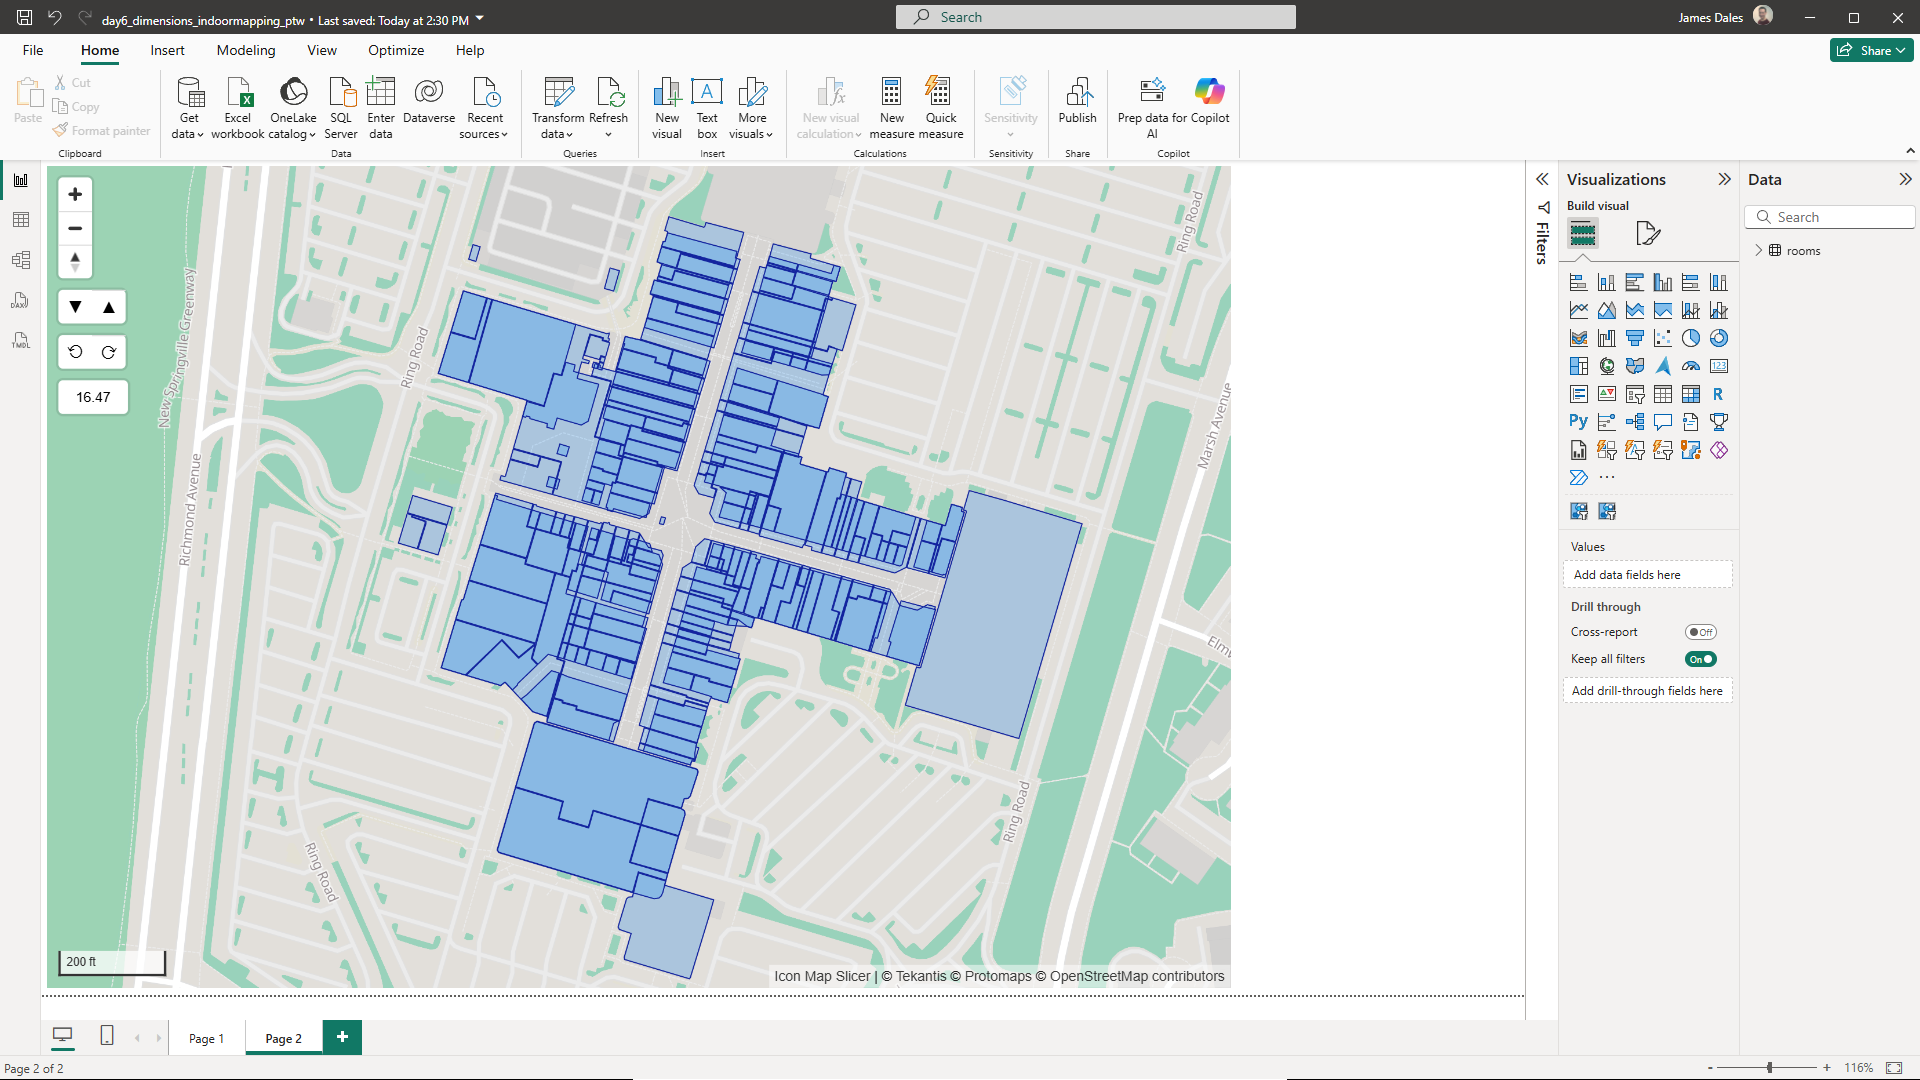
Many large or public building on OpenStreetMap have indoor room geometry defined. For example, this is Staten Island Mall:
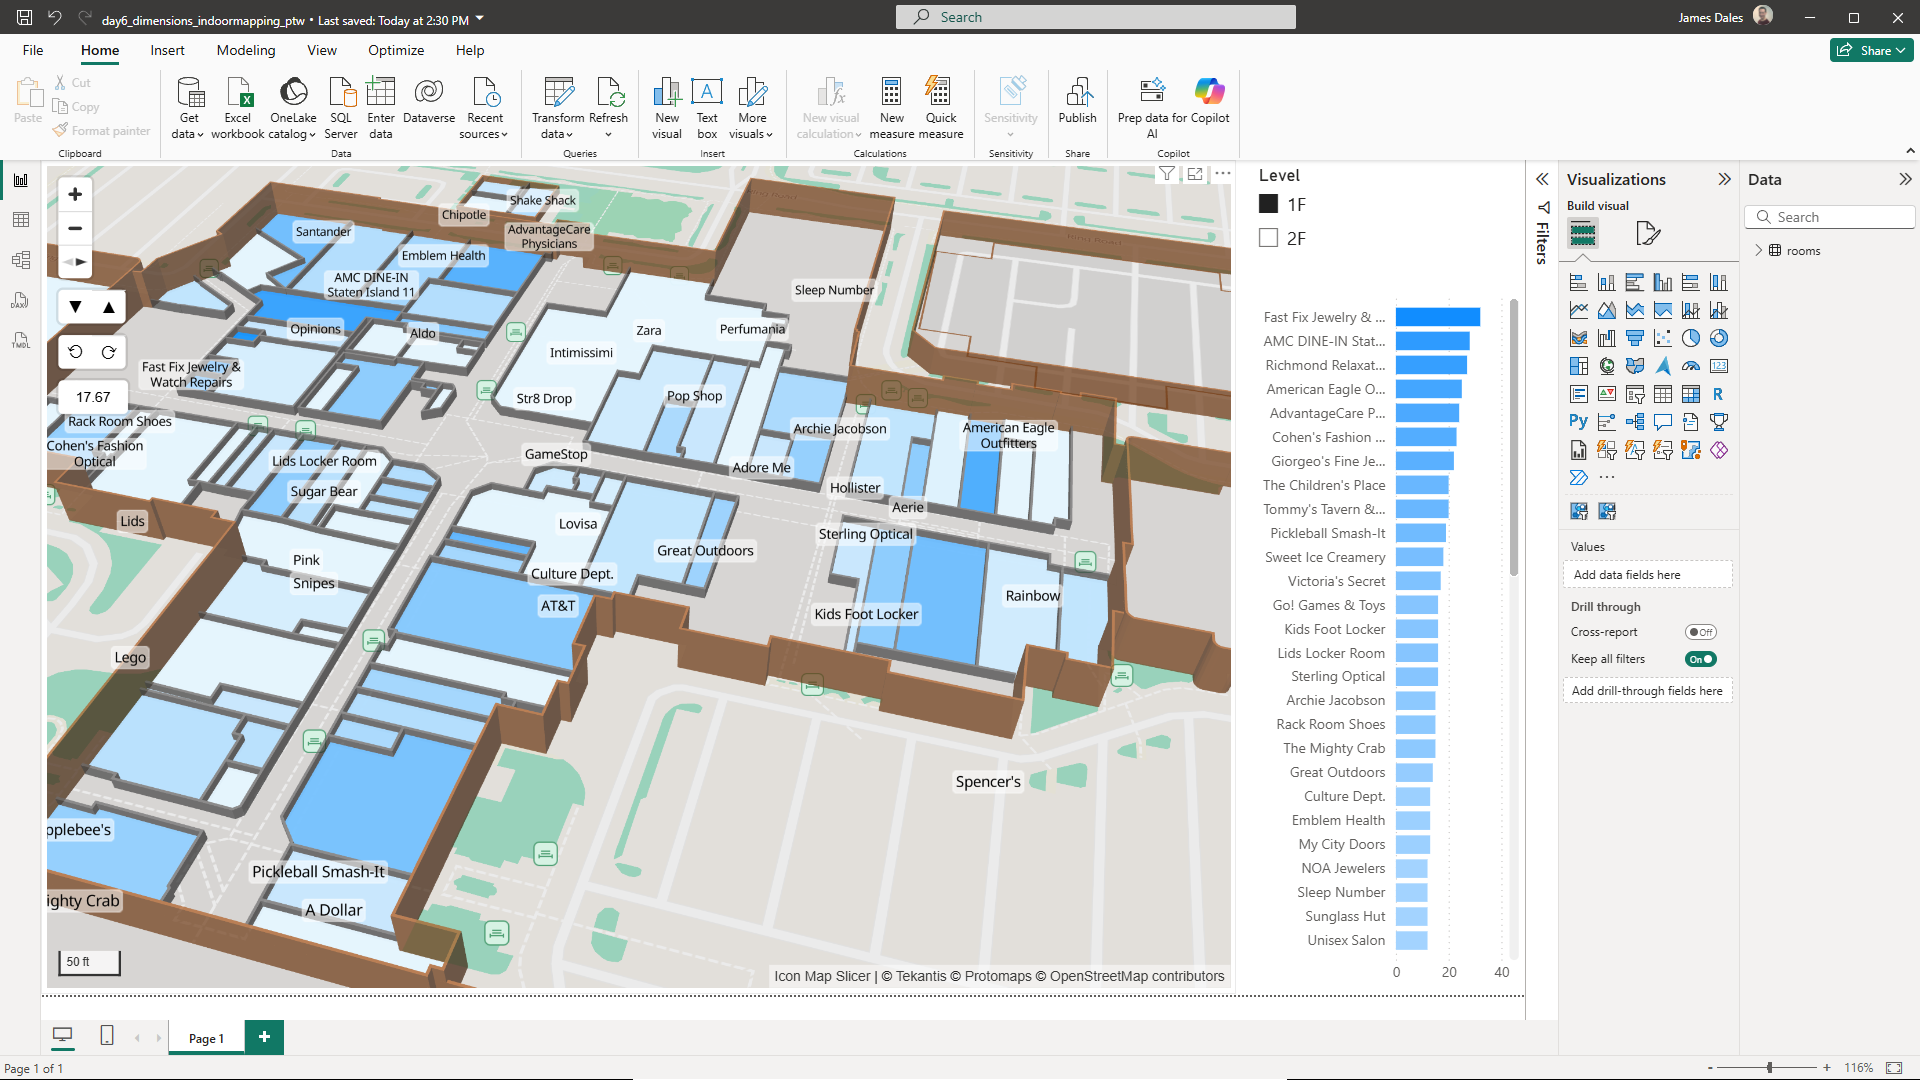
The building and internal room information however, is just polygons. To create the effect of walls, we need to create polygons representing the outline of those polygons. To do this, I asked Chat GPT to create me a python script that will extract the data from OpenStreetMap (initially using the Nominatim API to locate the building, then Overpass Turbo to extract the shapes), and then generate a number of GeoJSON files that we'll use in our Power BI report.
You can download the Python script here.
You will need to install the dependencies:
pip install shapely pyproj
And then for this example run the following:
python osm_building_polygons.py "Staten Island Mall" ^
  --mode buildings ^
  --geom walls ^
  --wall-thickness 0.6 ^
  --room-wall-thickness 0.5 ^
  --clip-room-walls ^
  --clip-mode wall ^
  --room-gap 0.25 ^
  --building-color "#8B4513" ^
  --room-color "#2E64FE" ^
  --room-interior-color "#87A9FF" ^
  --default-room-height 3.0 ^
  -o staten_island_mall-merged.geojson ^
  --debug
This should output a number of GeoJSON files. We're going to use:
- staten_island_mall-buildings.geojson - Contains the outline of the mall buildings
- staten_island_mall-rooms.geojson - Contains the outline of the internal rooms
- staten_island_mall-rooms-interiors.geojson - Contains polygons of the room interiors
Let's import the staten_island_mall-rooms-interiors.geojson using PowerQuery and store the contents inside our Power BI model.
Note when we load it in, we use the Text.FromBinary function to keep the original GeoJSON geometry
    // NEW: keep geometry as raw GeoJSON text
    #"Added geometry text" = Table.AddColumn(#"Expanded features.properties", "geometry_text", each Text.FromBinary(Json.FromValue([features.geometry]))),
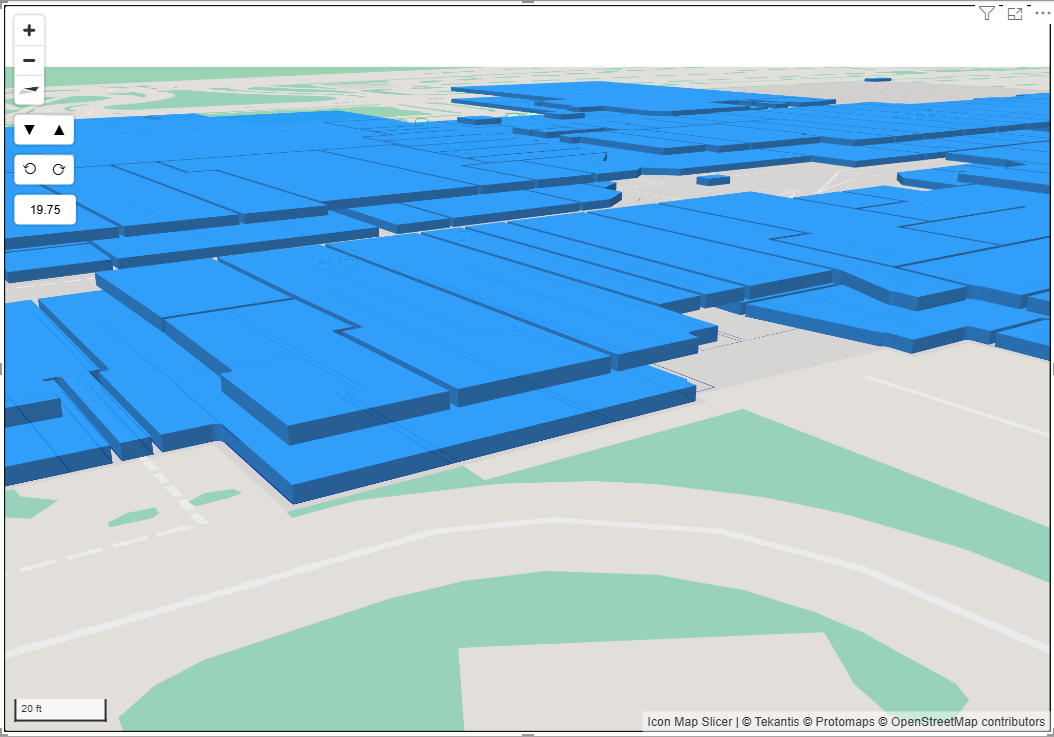
We can then add this as a GeoJSON (from data) layer in Icon Map Slicer. Initially we get something like this:
Both floors get added at the same time so we can introduce a Power BI slicer to switch between them using the level:ref field.
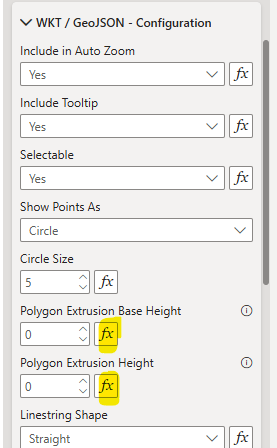
In the layer configuration we can now use the "fx" buttons to bind the bottom and top of the polygons to the min_height and height properties in our data:
For this report, I've created a height value sightly lower than the actual height so that we will be able to see the walls once in place. For example here's both floors in view at the same time. The reduced height means there's a gap between them.
We can now apply conditional formatting to set the fill color based on a value in our data.
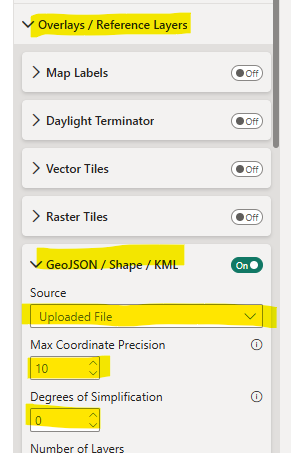
Now let's bring in the building walls. This time we're going to use the staten_island_mall-buildings.geojson file. This file contains the exterior walls and already has the height property set. Rather than load it as a data layer, we're going to add it as a Reference Layer. Before we upload the file, as our coordinates a very detailed, we need to override the default settings that simplify the shapes when we upload them:
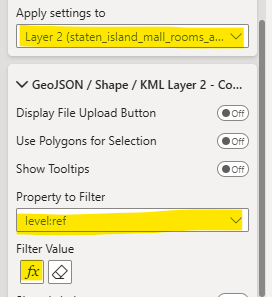
With the building outlines enabled, we can now set the Number of Layers to 2, select Layer 2 in the dropdown, and then import the room outlines file: staten_island_mall-rooms.geojson
This file contains the room walls for both levels, however we can filter the file to only show the level selected in our slicer. Select the "level:ref" for the "Property to Filter" settings, then for "Filter Value" use the "fx" button to select the level:ref field in the Power BI data.
You should now have the walls of the rooms and building outline showing in your report.
You can download the Power BI .pbix file to see see how it was created.