
Day 5 of the 30 Day Map Challenge is all about "Earth".
Classical Elements: Focus on the tangible and grounded. Map landforms, geology, soil, agriculture, elevation, or anything solid beneath your feet.
The most obvious place to turn for this challenge was the United States Geological Survey. For my map, I used part of a dataset created for the Critical Minerals Mapping Initiative that reclassifies geologic map units across the U.S. and Australia into 31 generalized rock types. It provides a simplified view of the country’s underlying geology, highlighting the diversity of igneous, metamorphic, and sedimentary formations. I've just mapped the data for the contiguous US.
The data set is made up of more than 300,000 unique polygons and is well over a gigabyte in size. Even simplified this would be a challenge to load into a Power BI report to be displayed either as a GeoJSON layer or databound WKT. Therefore I've turned again to a tiled layer, and converted it to a PMTiles file.
Unlike yesterday's deprivation report where we created a static style and used it as a reference layer, today I'm using it as a data bound layer, based on the rock classification. I'm then binding this classification to the Power BI data, so I can conditionally format it based on the rock classification, and cross-filter from other visuals.
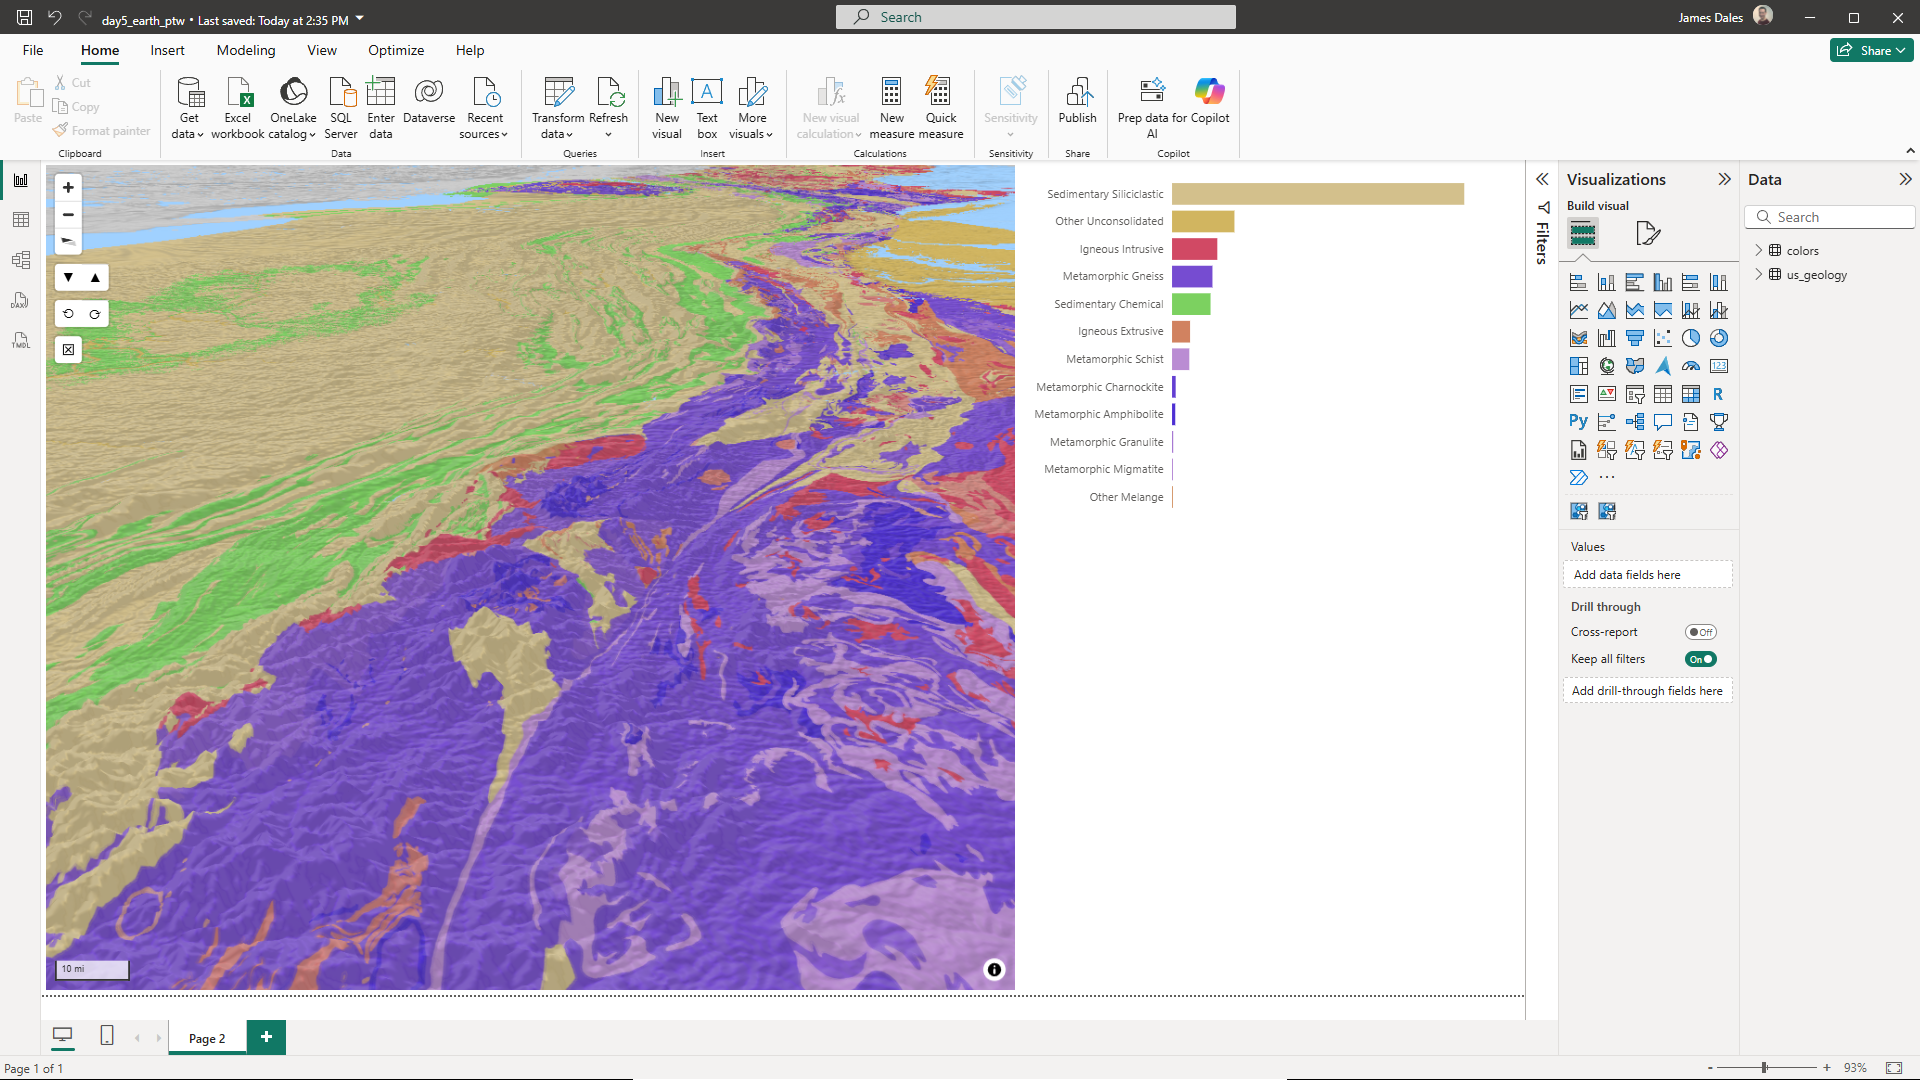
I've also added longitude and latitude centroids for each of the polygons. This means that using Icon Map Slicer, as I move around and zoom into the map, the bar chart on the right automatically filters to show the rock makeup of the area we're looking at.
Finally I customized the background map. I used the toner style and removed all the elements from it to just leave a monochrome map of the countries. I then tweaked the colors so that the water is blue and the land gray. Finally I enabled hill shading and 3D terrain.
Here's the resulting report:
You can download the Power BI .pbix file to see see how it was created.