
On to day 3 of the 30 Day Map Challenge and today's theme is Polygons:
Challenge Classic: Create a map focused on area features (e.g., administrative regions, land use, boundaries). Use fills, patterns, and choropleth techniques.
A few days ago, the Ministry of Housing, Communities and Local Government released an updated English indices of deprivation statistical release. This measures relative levels of deprivation in 33,755 small areas or neighbourhoods, called Lower-layer Super Output Areas (LSOAs), in England.
We hear from lots of users of Icon Map looking to use the earlier 2019 release of this dataset, so I was keen to get the latest version into Icon Map Slicer.
While the dataset is useful on its own, it's best used to add context to other data, so rather than visualize it alone, my goal here is was to add it as a reference layer behind some open crime data from data.police.uk.
Given there are over 30,000 LSOA's alone, I've decided to add this as a reference layer, rather than populate it from Power BI data. This means that the the deprivation indexes are stored within the original geojson file itself, and then used to drive the coloring of each of the LSOA features, rather than importing the values into Power BI's dataset and using conditional formatting.
The next challenge is that LSOAs have detailed boundaries so ensuring there's sufficient detail when zoomed in requires a large source file - too big to load in as a GeoJSON layer. The answer was to create a vector tile layer with Tippecanoe in PMTiles format. This PMTiles file sits in Azure Blob Storage with no GIS or external mapping service required.
I then created a style file using the MapLibre Style Specification to format the polygons based on the deprivation values.
{
  "version": 8,
  "sources": {
    "imd": {
      "type": "vector",
      "url": "pmtiles://https://iconmappropublictiles.blob.core.windows.net/catalog/england_IMD_2025/imd2025.pmtiles"
    }
  },
  "layers": [
    {
      "id": "imd-fill",
      "type": "fill",
      "source": "imd",
      "source-layer": "IMD2025LSOA",
      "minzoom": 1,
      "paint": {
        "fill-color": [
          "step",
          ["to-number", ["get", "IMDDecil"]],
          "#094081",
          2, "#0768AC",
          3, "#2B8DBE",
          4, "#4EB2D2",
          5, "#7BCCC5",
          6, "#A8DDB5",
          7, "#CCEAC4",
          8, "#E0F4DB",
          9, "#EEFCD9",
          10, "#FBFCF4"
        ],
        "fill-opacity": [
          "interpolate", ["linear"], ["zoom"],
          5, 0.55,
          10, 0.65,
          13, 0.75
        ],
        "fill-antialias": true
      }
    },
    {
      "id": "imd-outline",
      "type": "line",
      "source": "imd",
      "source-layer": "IMD2025LSOA",
      "minzoom": 5,
      "paint": {
        "line-color": "rgba(0,0,0,0.25)",
        "line-width": [
          "interpolate", ["exponential", 1.6], ["zoom"],
          5, 0.2,
          10, 0.5,
          13, 0.8,
          16, 1.2
        ]
      }
    }
  ]
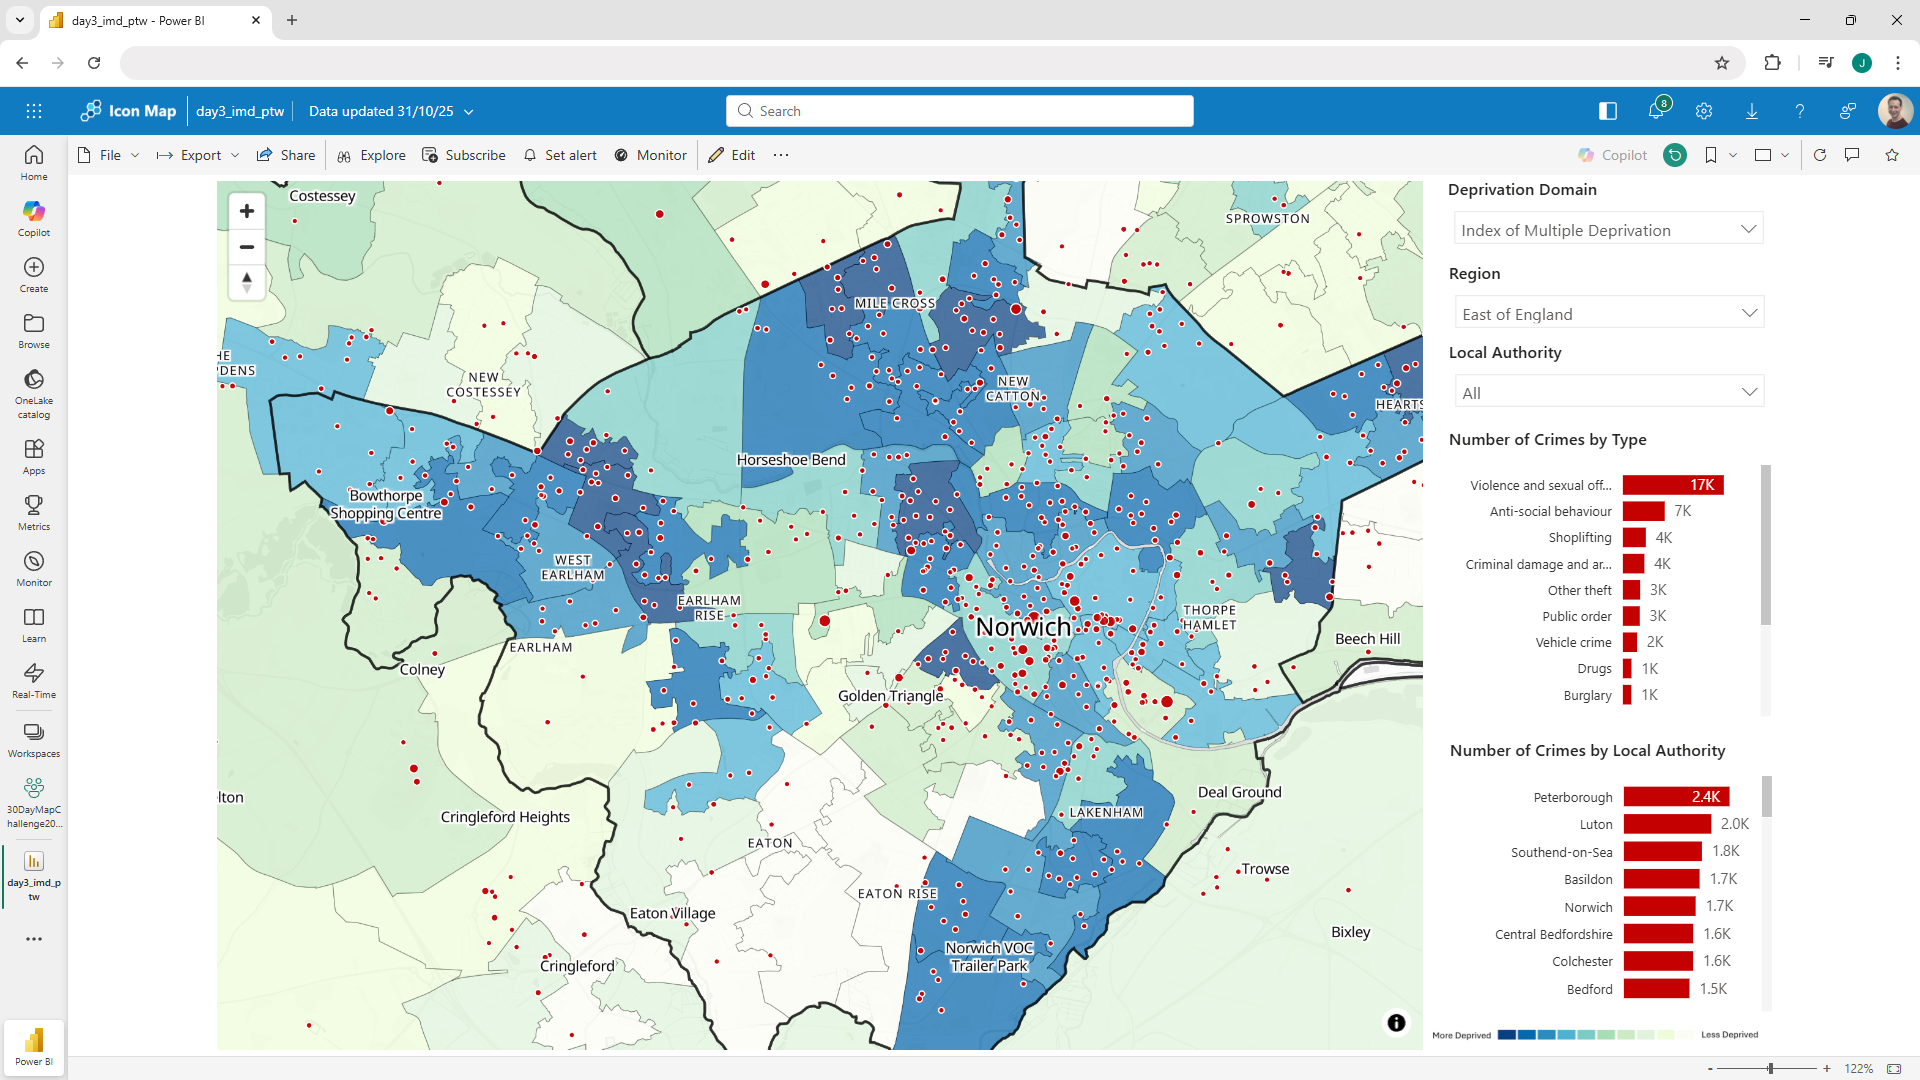
Here's the result. Notice how you can zoom from the whole country and still zoom right in without losing the detail.
But this is only part of the story. Next I loaded in the crime data as a simple circle layer, joining the data from data.police.uk to lookups from the ONS Geoportal using the LSOA code to obtain the local authority and region, which I make available as Power BI slicers to filter the crime data.
In a forthcoming release of Icon Map Slicer, we've also included the ability to filter reference layers using DAX expressions and a Power BI Slicer, so I then configured the report to filter the deprivation layer based on the selected local authorities.
I then extended the style sheet to add additional layers for each of the deprivation domains (Housing, Education, Health etc), adding a Power BI slicer to allow the report user to select a specific domain. I also added an additional layer for the local authority boundaries.
The end result means that not only is the crime data filtered based on the user's interactions, but also the reference layer. The benefit - no complicated data modeling and hundreds of thousands of data items displayed on the map.
Here's the Power BI .pbix file to download to see how it was put together.
And if all that sounds complicated, we're working hard on some ground-breaking new capabilities in Icon Map to make this whole process just a couple of clicks.