
Already day 14 of the 30 Day Map Challenge and today's theme is "Data: OpenStreetMap".
Use OpenStreetMap (OSM) data as your primary source. Map your favorite feature, contribute back to the project, or style the map in an interesting way.
I thought I'd use today to talk a little about our background map options - most of which use OpenStreetMap data as their source. I'm going to cover three subjects:
- Providing report viewers with a style selector
- Customizing background maps within Icon Map Slicer
- Customizing background maps using Maputnik
Providing report viewers with a style selector
We don't currently have a built in style selector within Icon Map - this is on our roadmap. In the meantime you can build yourself one using Power BI's button slicer visual.
Here's a quick guide:
Import the list of styles
In Power Query use the web connector, and import the list of our styles from: https://styles.iconmappro.com/styles/styles.json
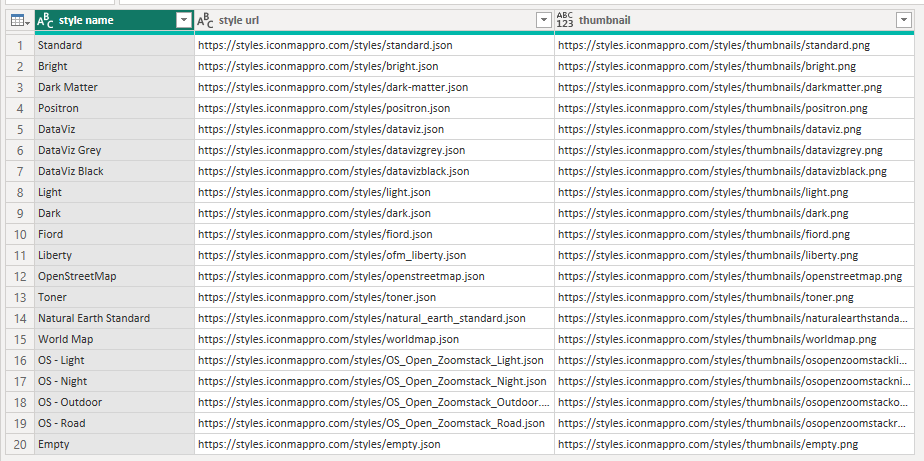
Filter the list so that you're only include those with the type "background". You can filter any styles that you don't want to include (e.g. Empty or the Ordnance Survey ones that only have coverage for Great Britain).
You should end up with a list something like this:
Or grab the code from here:
let
    Source = Json.Document(Web.Contents("https://styles.iconmappro.com/styles/styles.json")),
    #"Converted to Table" = Table.FromRecords({Source}),
    #"Expanded styles" = Table.ExpandListColumn(#"Converted to Table", "styles"),
    #"Expanded styles1" = Table.ExpandRecordColumn(#"Expanded styles", "styles", {"name", "url", "thumbnail", "type", "buildingheight", "multilanguage", "landuse", "pois", "attribution"}, {"styles.name", "styles.url", "styles.thumbnail", "styles.type", "styles.buildingheight", "styles.multilanguage", "styles.landuse", "styles.pois", "styles.attribution"}),
    #"Changed Type" = Table.TransformColumnTypes(#"Expanded styles1",{{"styles.name", type text}, {"styles.url", type text}, {"styles.thumbnail", type any}, {"styles.type", type text}, {"styles.buildingheight", type text}, {"styles.multilanguage", type text}, {"styles.landuse", type any}, {"styles.pois", type any}, {"styles.attribution", type text}}),
    #"Removed Columns" = Table.RemoveColumns(#"Changed Type",{"styles.buildingheight", "styles.multilanguage", "styles.landuse", "styles.pois", "styles.attribution"}),
    #"Filtered Rows" = Table.SelectRows(#"Removed Columns", each [styles.type] = "background"),
    #"Replaced Value" = Table.ReplaceValue(#"Filtered Rows","(GB only) Ordnance Survey Zoomstack ","OS ",Replacer.ReplaceText,{"styles.name"}),
    #"Renamed Columns" = Table.RenameColumns(#"Replaced Value",{{"styles.name", "style name"}, {"styles.thumbnail", "thumbnail"}, {"styles.url", "style url"}}),
    #"Removed Columns1" = Table.RemoveColumns(#"Renamed Columns",{"styles.type"})
in
    #"Removed Columns1"
Load that table into your Power BI dataset, but don't create any relationships to any other tables in your model.
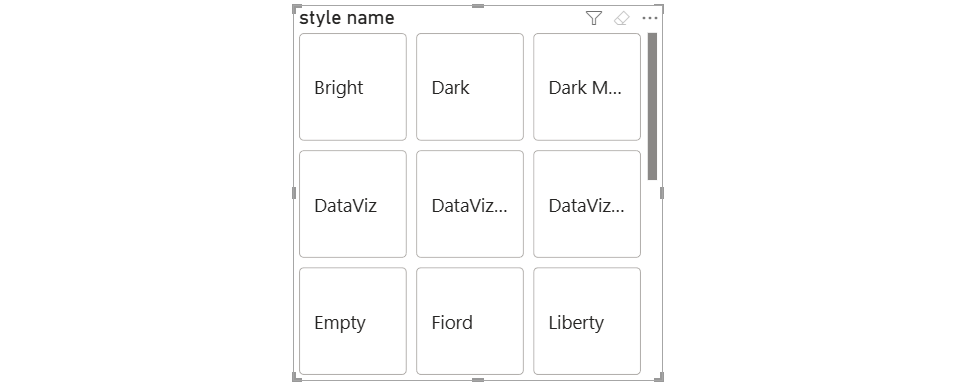
Add the button slicer visual to the report

Drag in the style name field into the "Value" section. You should now have a basic set of buttons with the name of each style in.
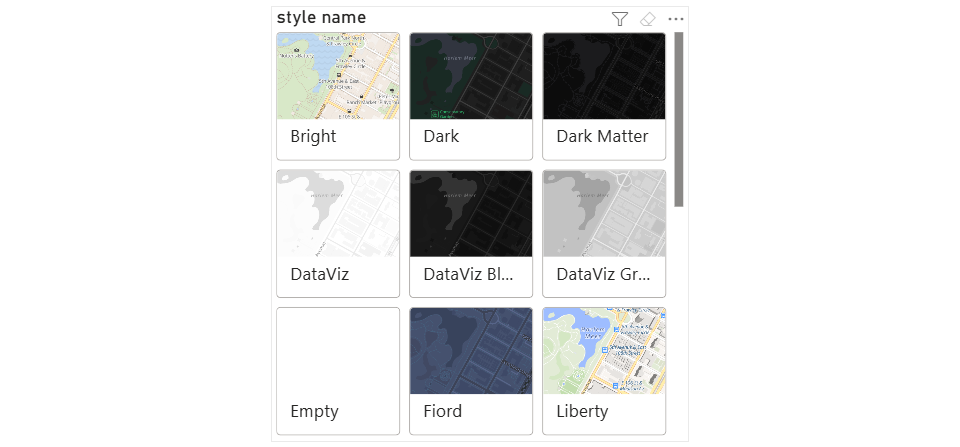
Next expand out the "Images" settings, and under Image -> Field click the "+Add data" button. Choose the thumbnail field from our imported styles data.
Your button slicer should now include images of each layer style:
You can now tweak the layout, font sizes etc.
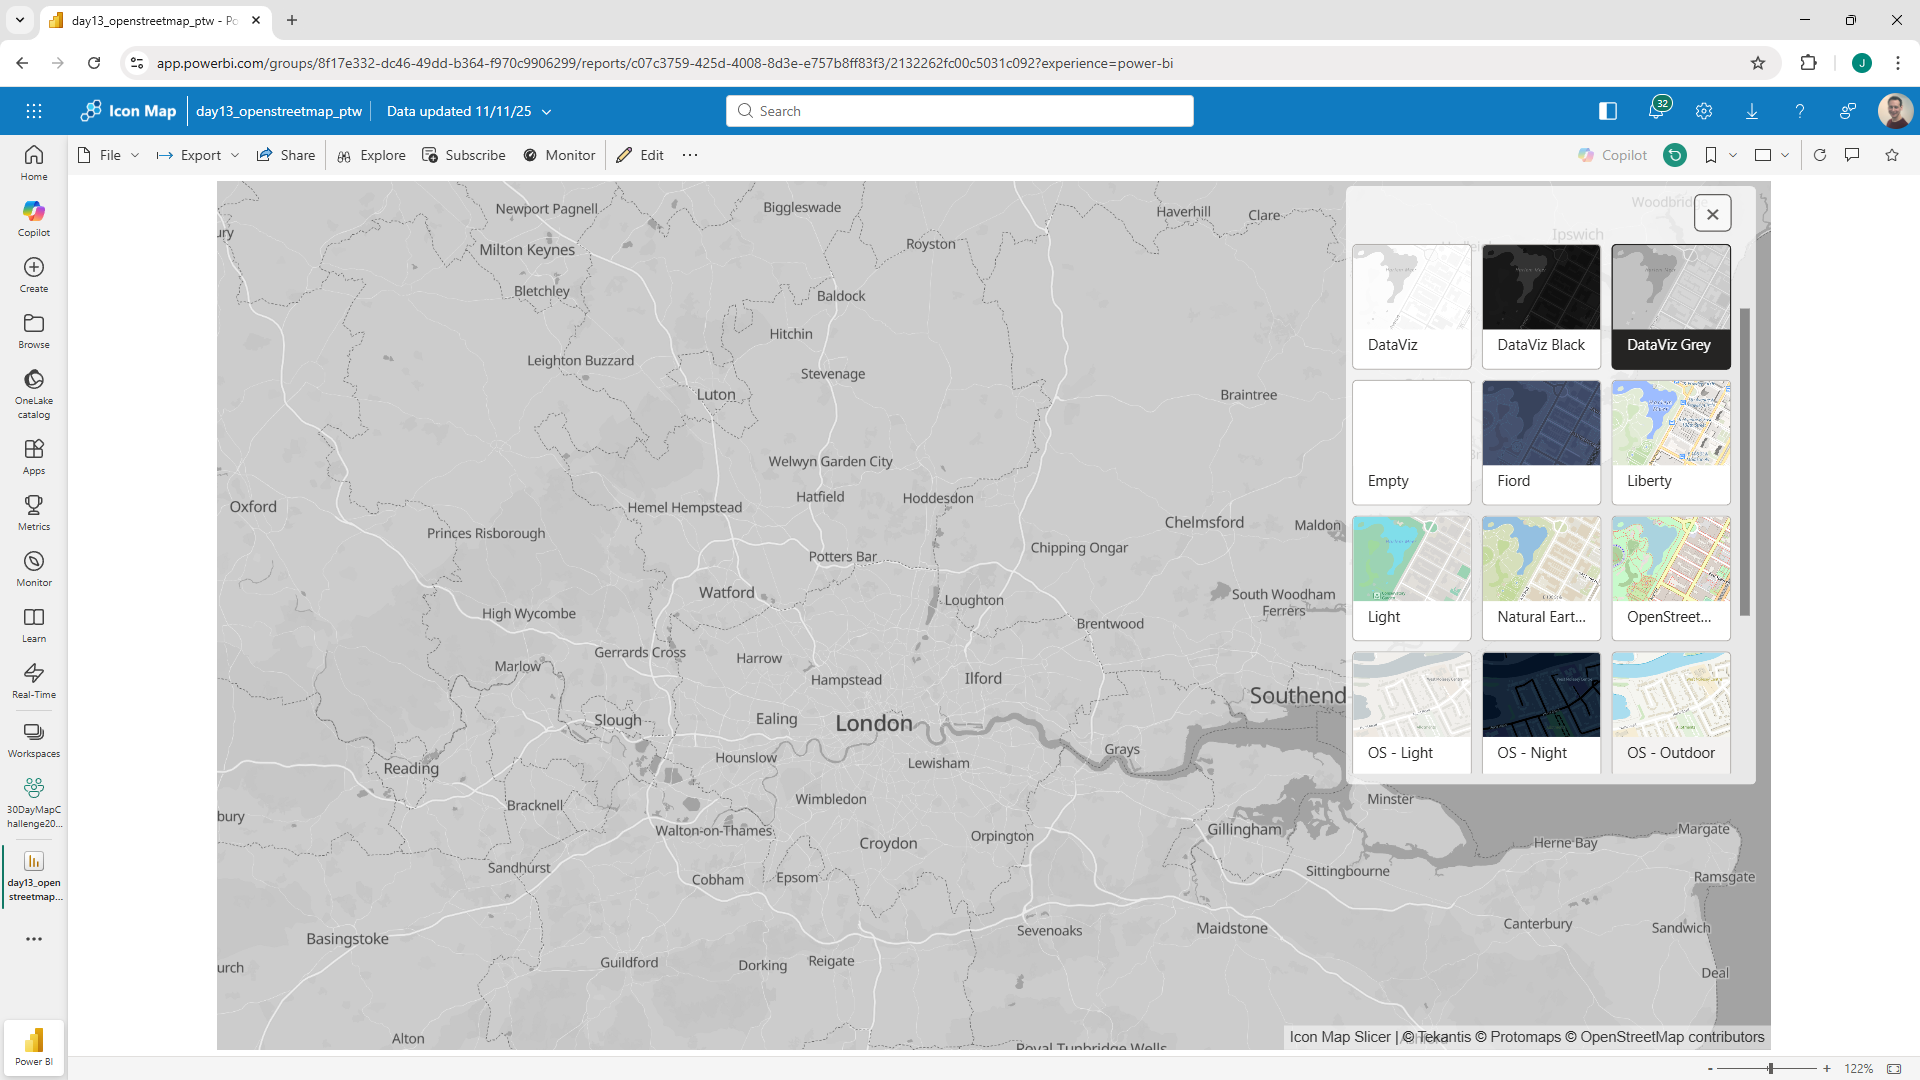
Once you're happy, let's wire the selected layer to Icon Map Slicer. In Icon Map Slicer's background settings, choose "Custom Style URL" for the "Map Style". Click the "fx" button next to the Style URL box, and choose the style url field from our styles data table.
Icon Map should now show the map style based on the selection in our button slicer.
With a couple of Power BI bookmarks and buttons we can make make the button slicer show and hide based on user selections.
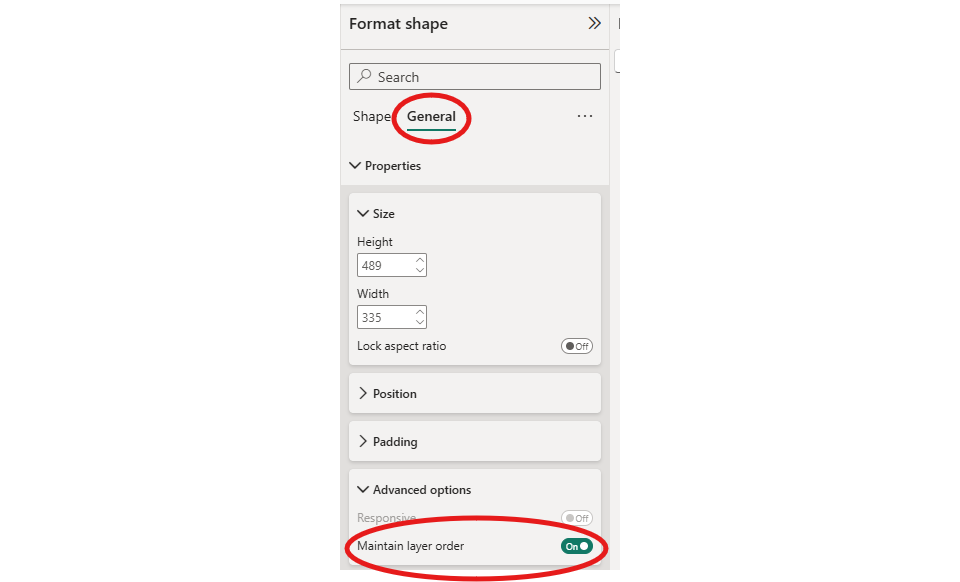
Ensure that the slicer, buttons and map all have the "Maintain layer order" setting enabled so that the buttons remain visible when the map is being used.
You should now have something that resembles:
Here's a Power BI report to show it in action.
And the .pbix file to download.
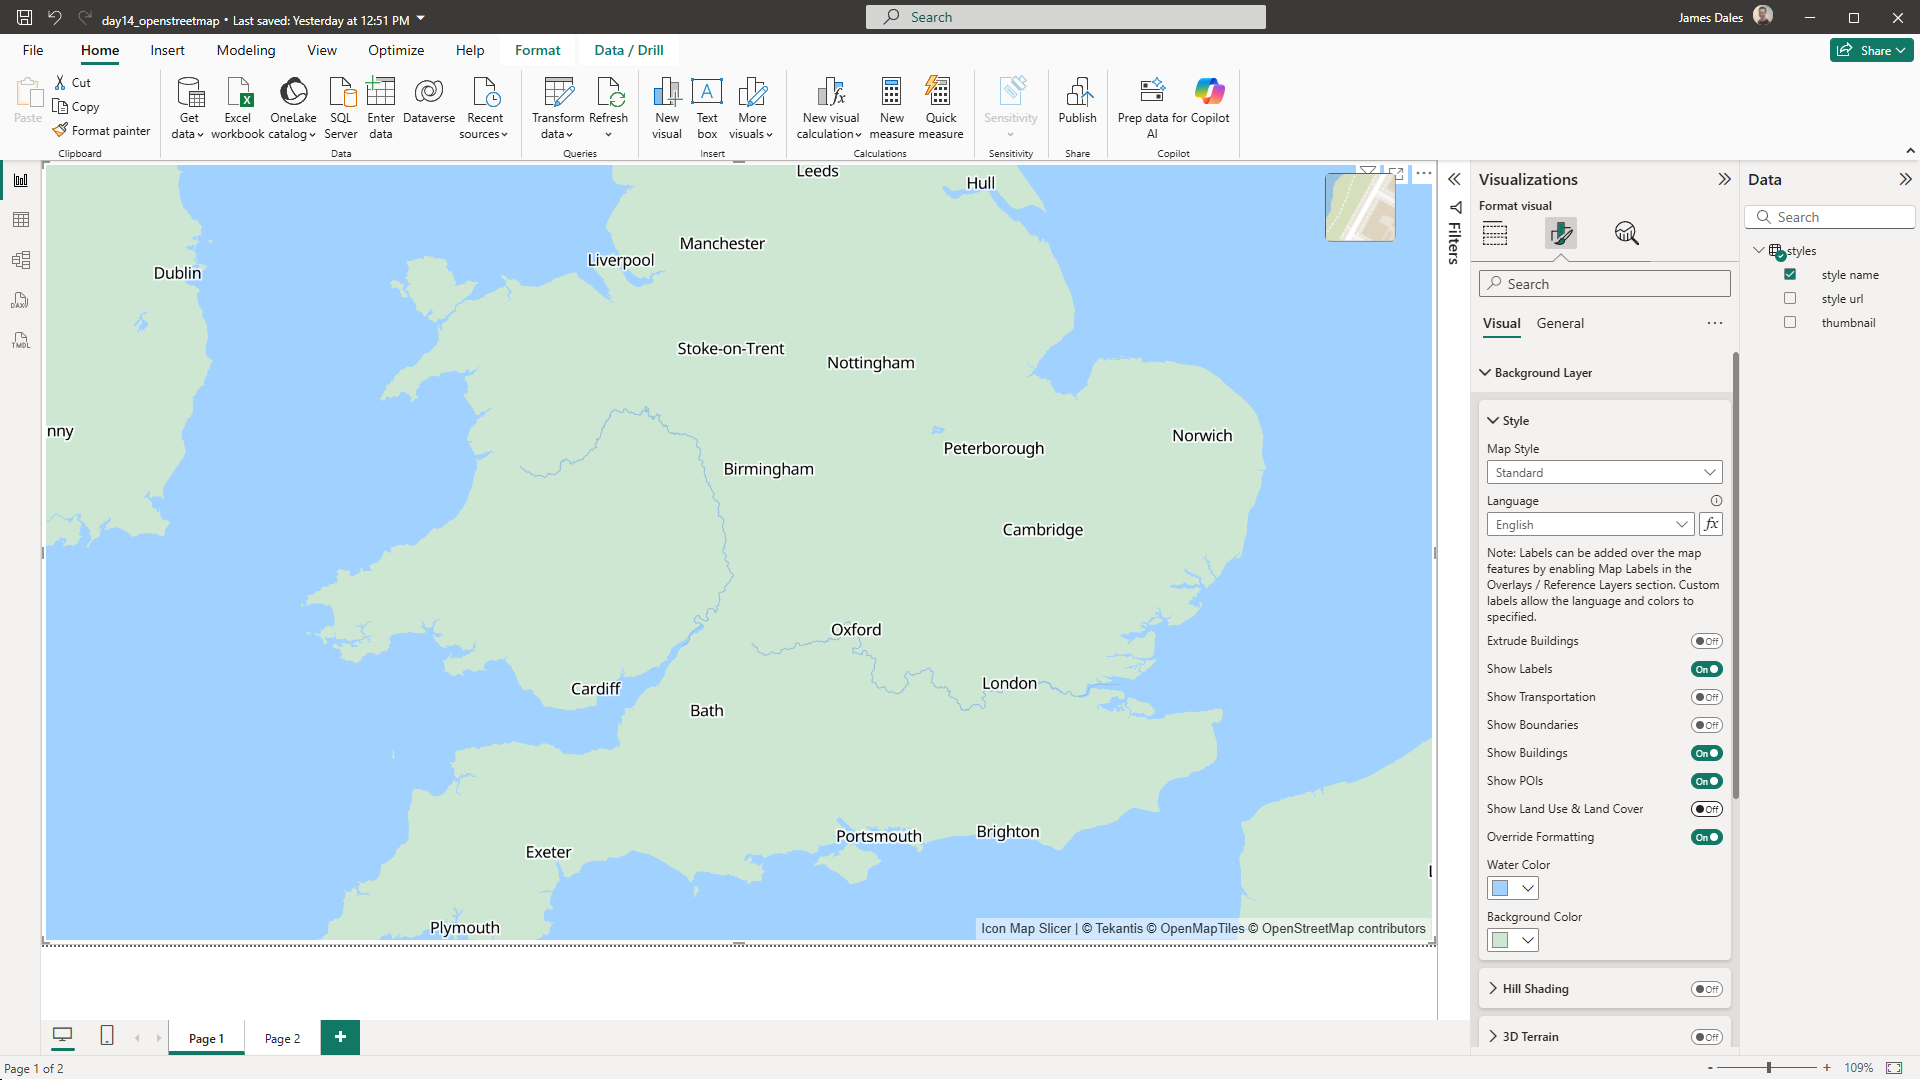
Customizing background maps within Icon Map Slicer
Icon Map Slicer gives you the option to hide some of the elements that make up the background maps from within the Power BI formatting pane. You can choose to include or remove the following items:
- 3D/2D buildings
- Text labels
- Roads and railways
- Administrative and country boundaries
- Points of Interest
- Land use
In addition you can turn on the "Override Formatting" property and customize the color of the water and land.
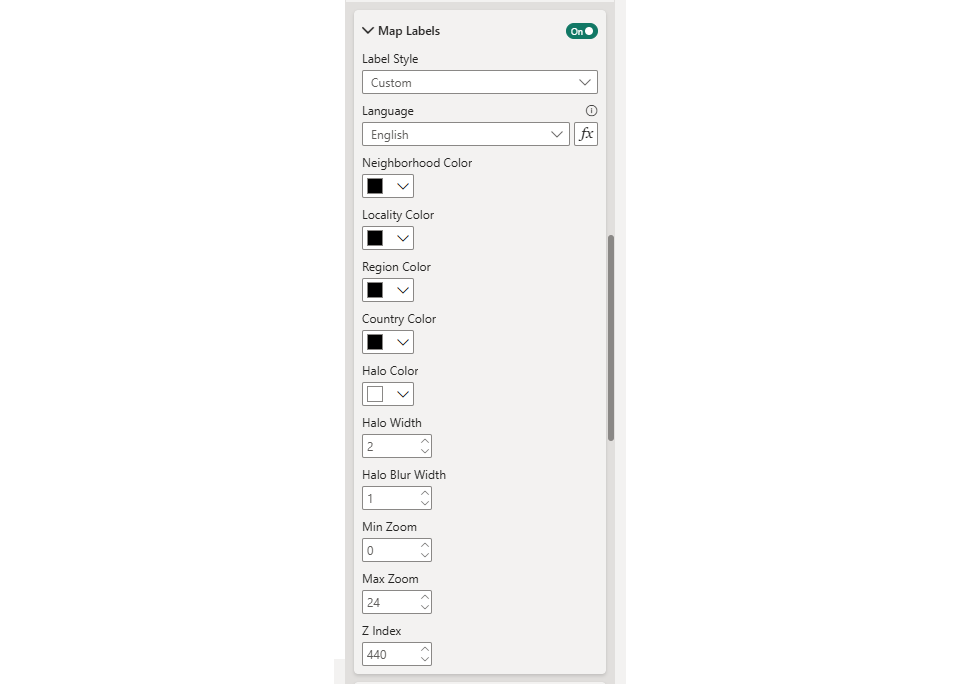
Map text labels
If your map labels appear under your data items, then I would recommend turning off the map labels from the background map and instead turning on Map Labels from the Overlays and Reference layers section. If you select "Custom" you can customize the colors, language and zoom levels that these appear at. If you ensure that the Z-Index number is higher than the Z-Index of your data layers, this will ensure that your map labels appear on top.
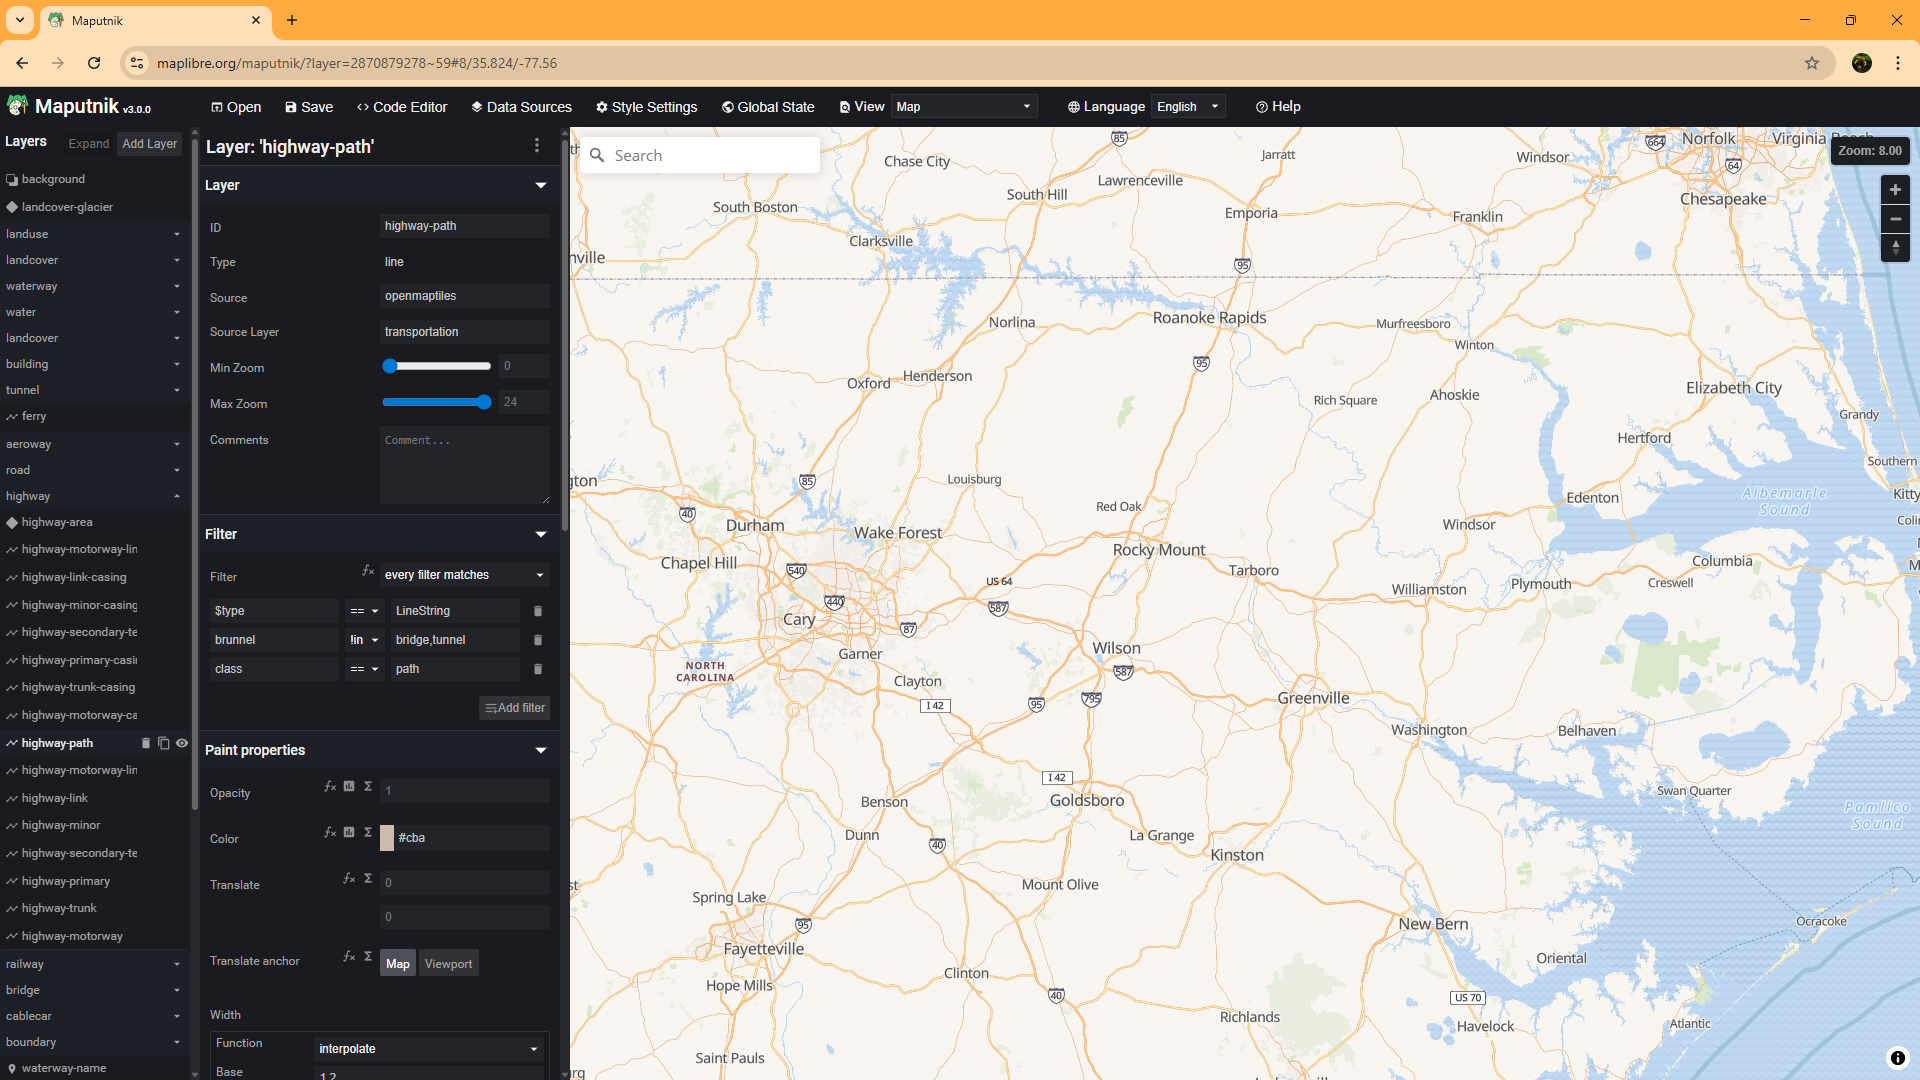
Customizing background maps using Maputnik
If you'd like more control over the background layer and want to customize it further then you could edit the json styles manually, or use a tool such as Maputnik.
Use Maputnik's Open from URL to paste in one of our style URLs. Eg: https://styles.iconmappro.com/styles/positron.json
You can then modify the style using the user interface.
Once done, save the resulting .json configuration to a location accessible by Icon Map, and use that custom URL for the background map.
You can find a guide to using Azure Blob storage on our blog.